The GMI has fallen to 1 for the first time since last March. The IBD Mutual Fund Index is now below its 50 day average, a major negative sign for me. I cannot make money on the long side when these growth mutual funds do not do well. I am therefore mainly in cash in my trading accounts, with my few long positions protected with put options. The key to success in the market is to lose little money when the odds are against me. There is a time to be out of the market, ready to jump in if the trend reverses. Tuesday was the second day of the new QQQ short term down-trend. I remain fully invested in mutual funds in my university pension because the longer term trend remains up—for now.
Month: May 2011
GMI declines to 2; New QQQ short term down-trend; on the sidelines; T2108 not at an extreme
I am in cash and/or totally hedged in my trading accounts. In a market like like this it is better to be safely on the sidelines. All of my great gurus have written that there is a time to be out of the market. My university pension remains fully invested, however. I only move that money out of equity funds when the longer term trends turn down.
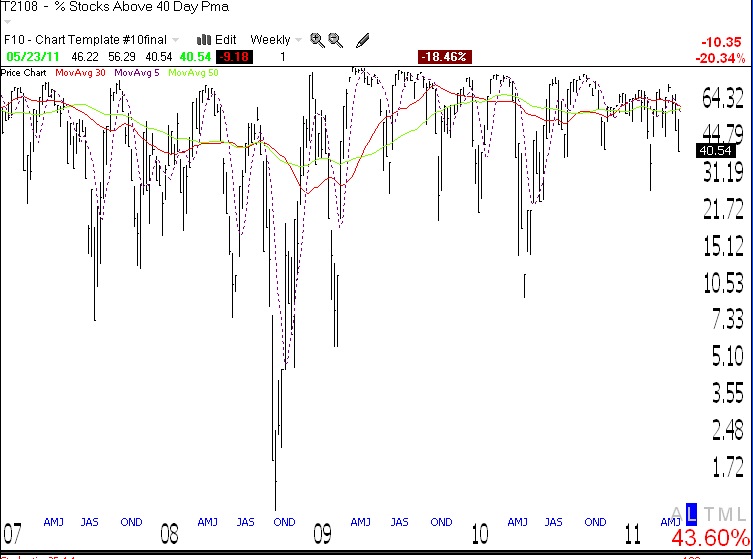
The Worden T2108 indicator is now around 41% (40.5), but way above where prior significant declines typically end. See the weekly chart of T2108 below. It measures the percentage of all NYSE stock that closed above their 40 day simple moving average. Click on chart to enlarge.
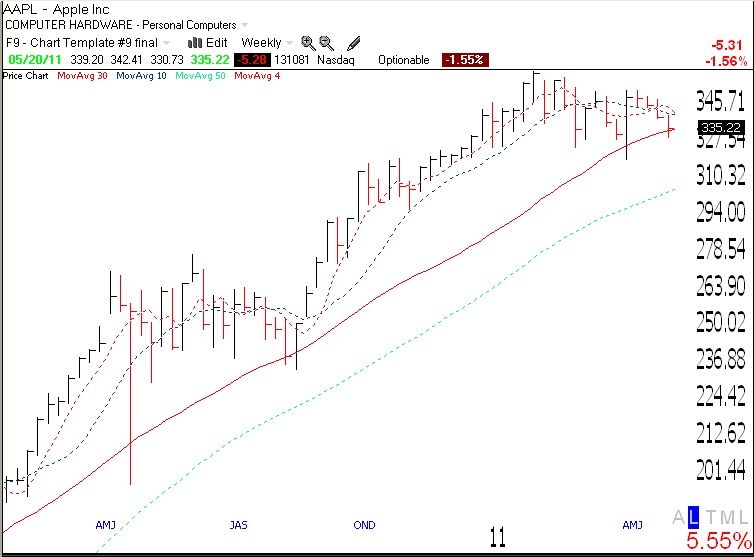
The markets look treacherous and AAPL is at a critical point.
We are in one of those periods when the market refuses to send me clear signals regarding the short term trend. I am therefore mainly in cash and/or completely hedged in my trading account. I am buying put options as insurance on all long positions. 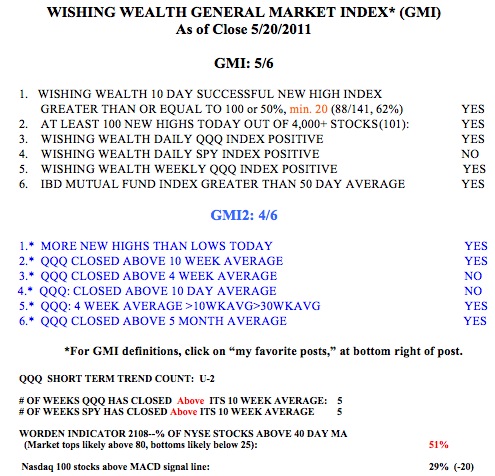 The GMI is at 5 (of 6) and the GMI2 is at 4 (of 6). Friday was the second day of the new QQQ short term up-trend. However, the QQQ could start another short term down-trend with a decline on Monday. Only 29% of the Nasdaq 100 stocks closed with their MACD above its signal line, reflecting short term weakness. The Worden T2108 is at 51%, in neutral territory.
Check out the weekly chart of the QQQ below. The QQQ has an RWB pattern and remains in a strong longer term up-trend. Nevertheless, we could experience short term weakness for a while. IBD continues to label the current market as being in a correction. 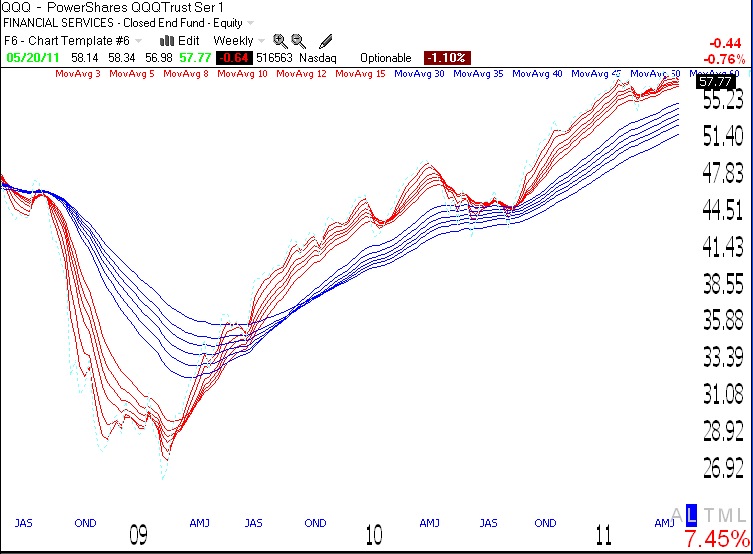
Meanwhile, AAPL is sitting on key support. A close below the 30 week average (red line) would be an ominous sign for it as well as the rest of the market. When AAPL cannot hold up, how can the market? Click on chart to enlarge.