33rd day of QQQ short term down-trend; DDD surges

GMI2/6
GMI-23/9
T210845%

One more strong day for the QQQ will begin a new short term up-trend.   However, the GMI is back to 2 and it will take a few more strong days for that indicator to signal a buy.   Even so, I nibbled a little at TQQQ on Monday and will add more on Tuesday if a new short term up-trend should begin.   I am never confident of a   short term trend change until it reaches day 5.

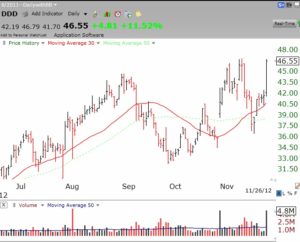
Last May 24, I wrote that my “concept” stock buddy, Judy, liked the 3D printing business and the company, DDD.   DDD closed then around $30.   Well, look at the day DDD had on Monday, up 11.5%!   3D printing is an entirely new field of technology. If you think that it is related to those movies we saw as kids with those special red and green glasses, you better research this new concept! Below is a daily chart of DDD.   Note its two recent advances on huge trading volume–funds are buying. (Click on chart to enlarge.)   Is this a promising cup and handle pattern?   Given the stock’s recent relative strength, I would not be surprised to see DDD as a leader in the next market advance. Also check out SSYS, another 3D company.


IBD calls new up-trend; looking at TQQQ

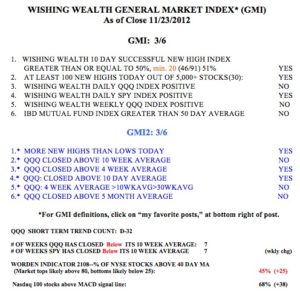
After adjusting trading volume for the shorter trading day on Friday, IBD said Friday constituted a follow-though day of the rally   and proclaimed a new up-trend.   The GMI and GMI-2 are both at 3 and could easily give a buy signal this week. Two consecutive days with the GMI above 3 will produce a new buy signal. However, IBD is so good at calling the market’s trend that I will respect their opinion and exit my small short in position in SQQQ and start to slowly go long the TQQQ in stages. If this is a new up-trend there will be plenty of time to accumulate TQQQ on the way up. I am also impressed at the recent relative strength of FB, which I own.

31st day of QQQ short term down-trend; correction continues; FB strong

GMI1/6
GMI-23/9
T210834%

The market is not out of the woods. IBD still calls it in a correction.   And the GMI is only 1 (of 6).   The market is no longer oversold.   I am watching AAPL for clues of the market’s trend. A close of AAPL above 591 would suggest significant strength. But its 10 week average is about to cross below its 30 week average, a sign of weakness.

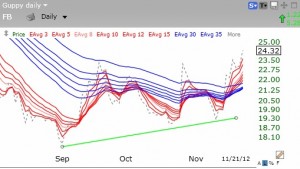
Meanwhile, FB continues to show strength, now closing at $24.32.   The daily Guppy GMMA chart shows that the short term averages (red lines) are now rising above the long term averages (blue lines), a major sign of strength. I own some FB.