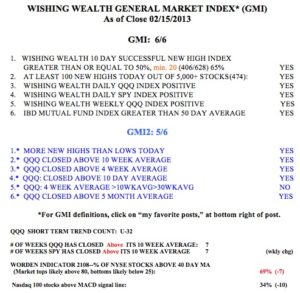
All of my indicators are now positive. Tuesday was the 33rd day of the QQQ short term up-trend.
Month: February 2013
T2108 weakening, getting cautious
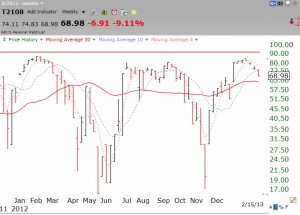
Although the GMI (General Market Index) remains at 6 (of 6) and on a buy signal, the Worden T2108 daily chart below looks like it is weakening and may be showing that NYSE stocks are starting to decline. T2108 shows that only 69% of the NYSE stocks are now above their average close over the past 40 days. In addition, only 34% of the Nasdaq 100 stocks closed with their MACD above its signal line, another sign of short term weakness. With more antics to be expected out of Washington the next two weeks, we may finally see some reaction to the sequester debacle in the market averages. So, I am getting quite cautious.

