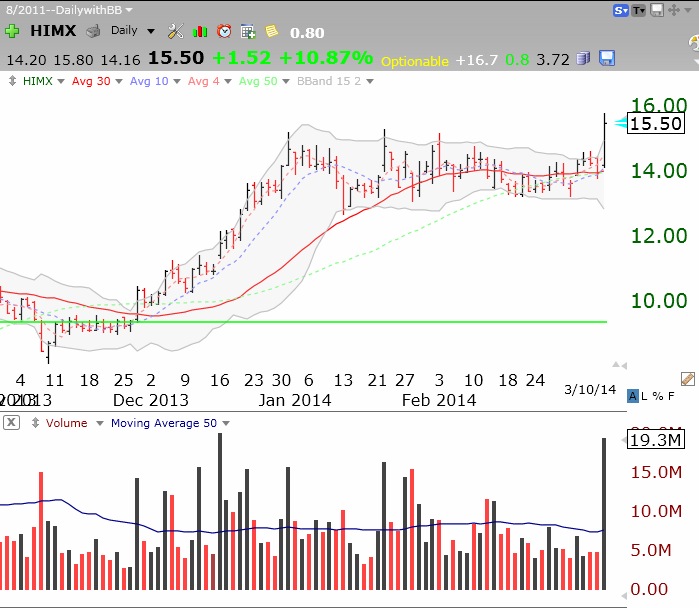
HIMX had a nice break-out of a consolidation above the green line on Monday. Look at the volume spike on this daily chart. HIMX makes parts for Google glasses. It has an IBD comp rating of 89.
Stock Market Technical Indicators & Analysis
HIMX had a nice break-out of a consolidation above the green line on Monday. Look at the volume spike on this daily chart. HIMX makes parts for Google glasses. It has an IBD comp rating of 89.
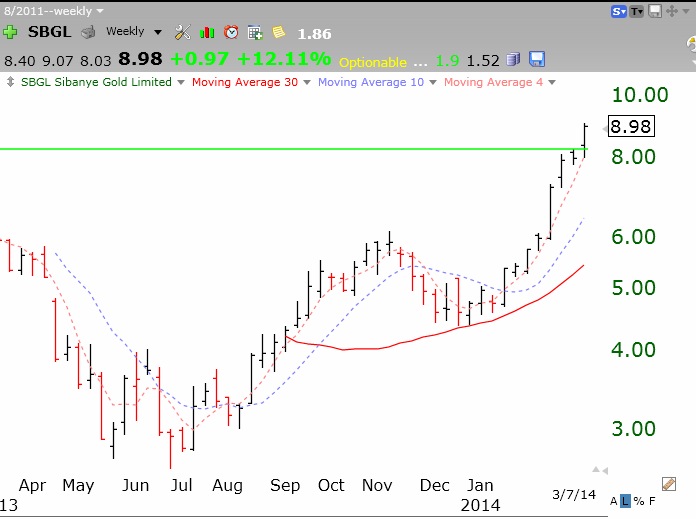
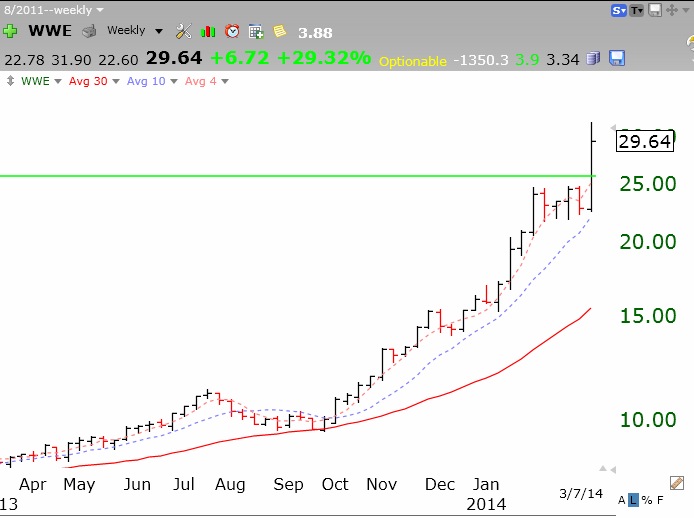
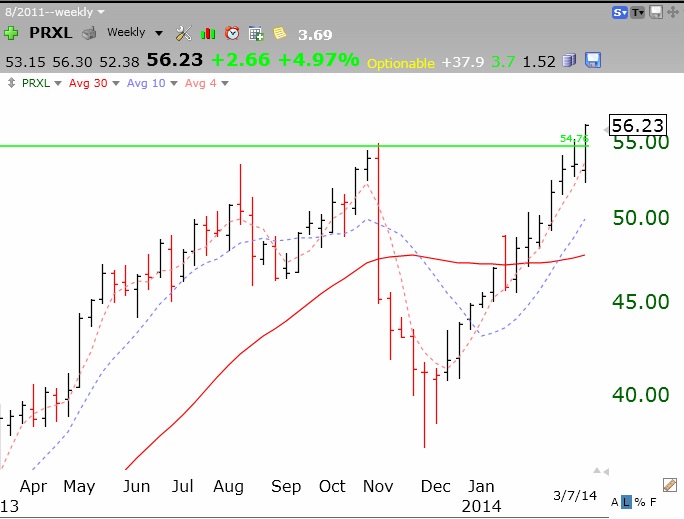
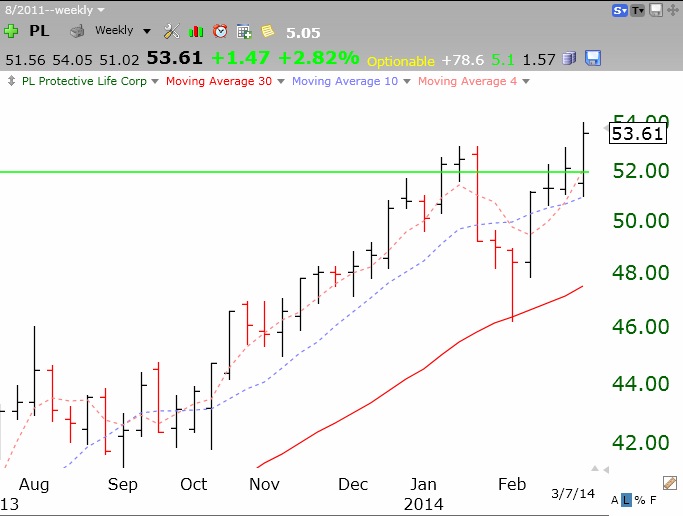
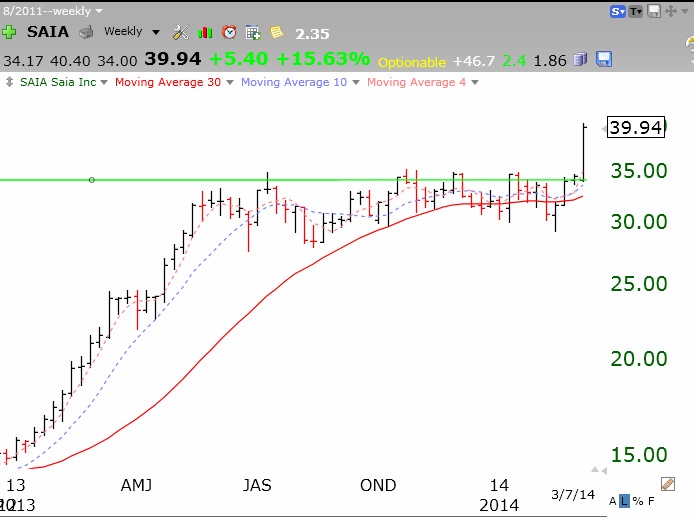
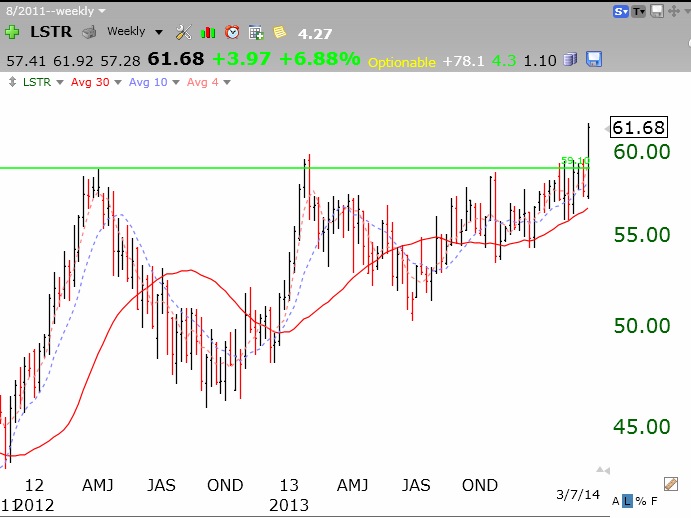
These 10 stocks broke through multi-month bases to all-time highs last week. I draw a green line at an all-time peak not broken for at least three months, sometimes for years. I then use TC2000 to put in an alert and send me an email when the green line is broken. All of my students receive the email alerts. Not all of these stocks will continue rising. Some will hover around their green line and some will retreat below it and still others will rise after testing the green line. I put these stocks in a watch list and monitor how they behave. Once a stock surpasses its green line, it may rise for months because there is no over head supply of sellers who bought at higher prices. Also, for a stock to break to an all-time high, especially on high volume, someone may know something good about the company. These stocks are worthy of further research.
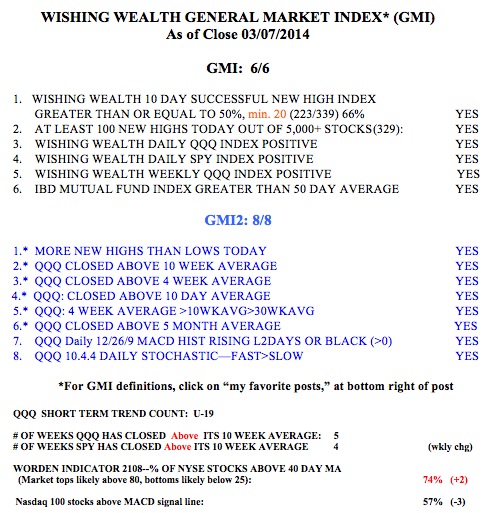
The GMI closed Friday at 6 (of 6) and the GMI-2 is at 8 (of 8).
 With all this hysteria about a market top forming like it did in 2007, I thought you might like to compare the market pattern in 2007 to now. Here is the weekly GMMA chart of the SPY in 2007. Note the danger sign that flashed well in advance when all of the short term averages (red) crossed below the longer term averages (blue):
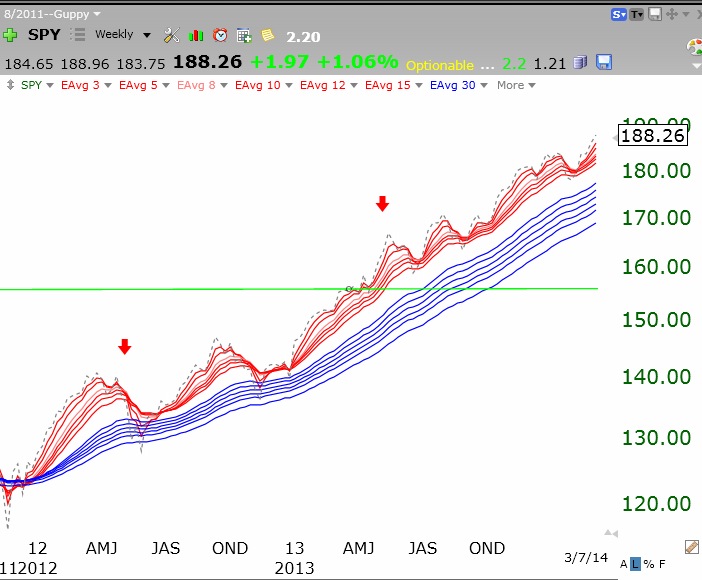
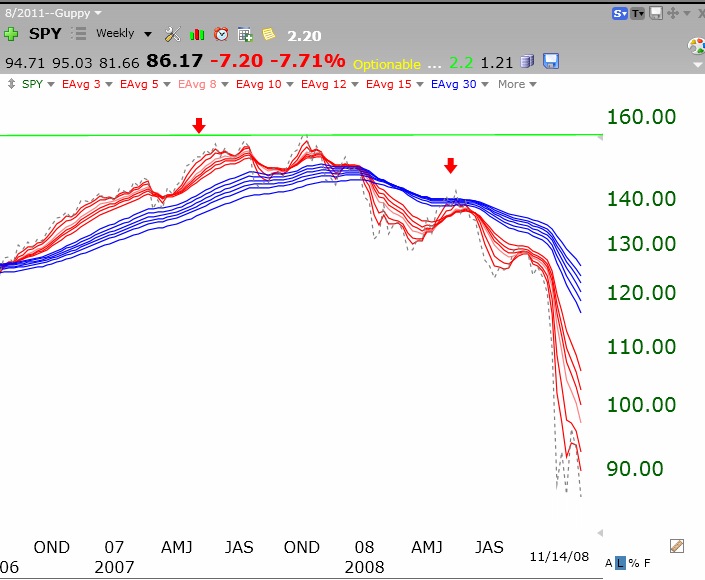 And here is a current GMMA chart of the SPY. See any resemblance? As the great bard once said, a coward dies a thousand deaths……
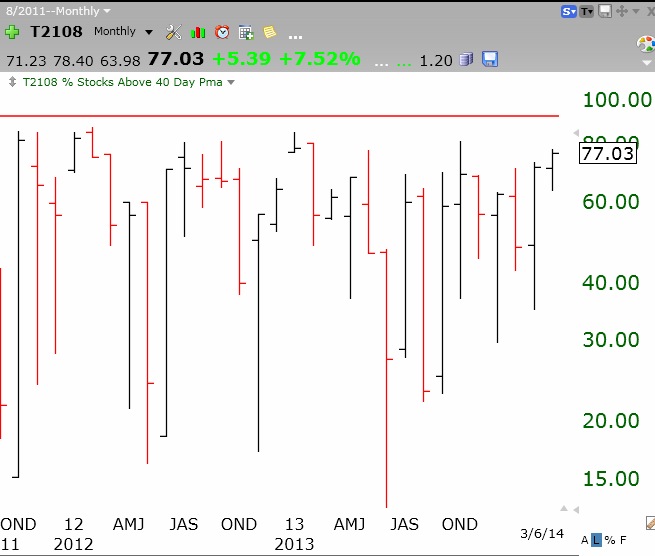
All of my GMI and GMI-2 indicators are now positive. One concern, however, is that the T2108 Worden indicator is now at 77%. This means that 77% of the NYSE stocks closed above their average price over the last 40 days. The closer T2108 is to 90% the more over bought the market tends to be. Check out this monthly chart of T2108, available in the Worden TC2000 software.
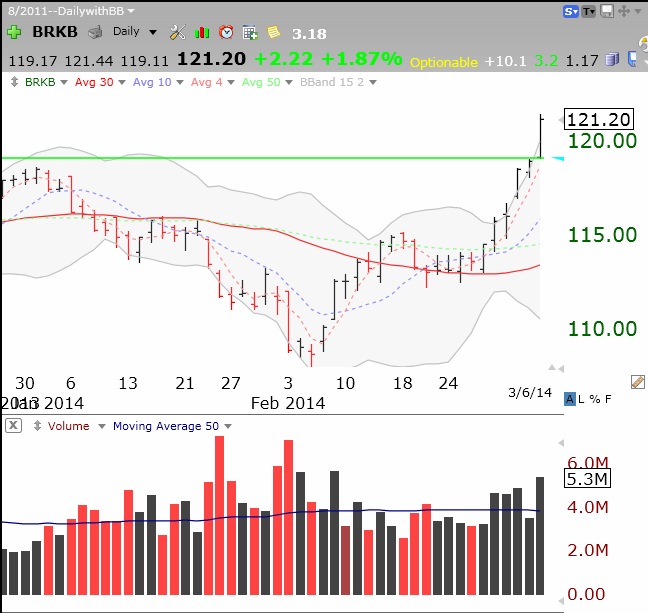
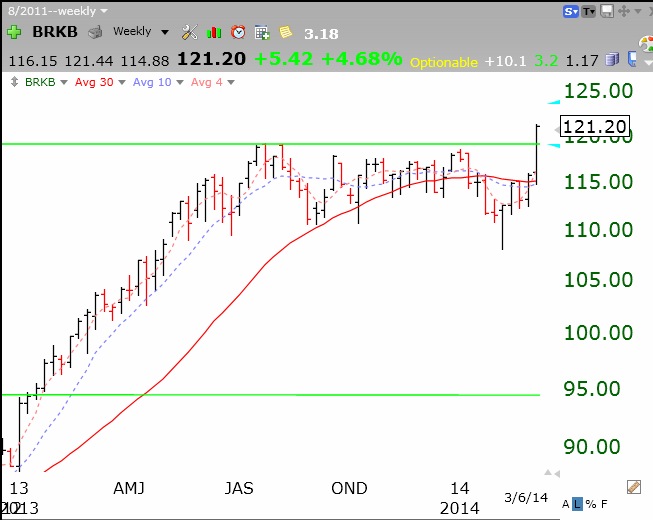
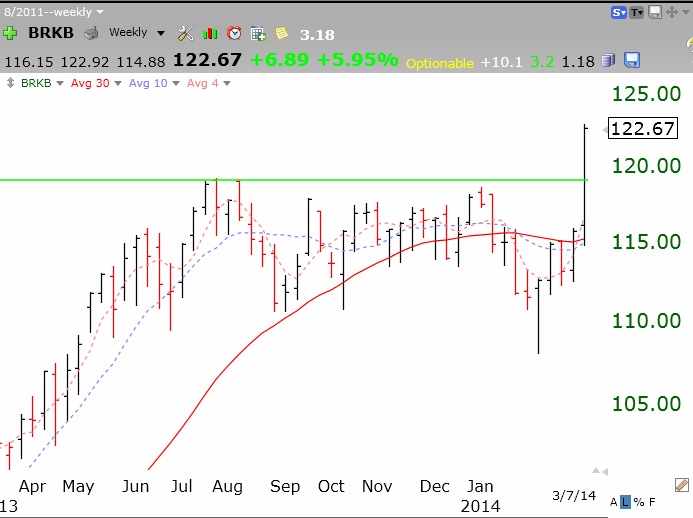
Bought some BRKB on Thursday. It had a nice green line break-out to an all-time high on above average volume. Check out its weekly chart.
And its daily chart.