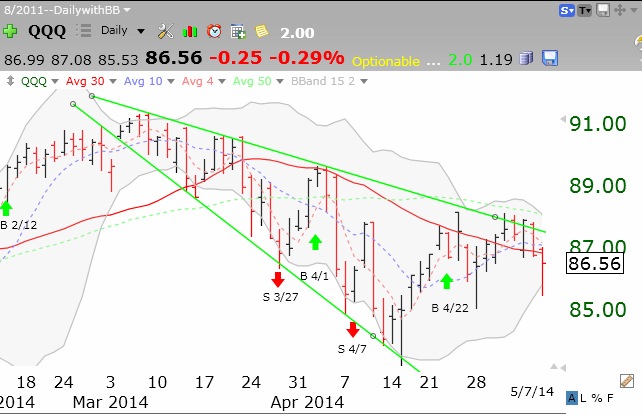
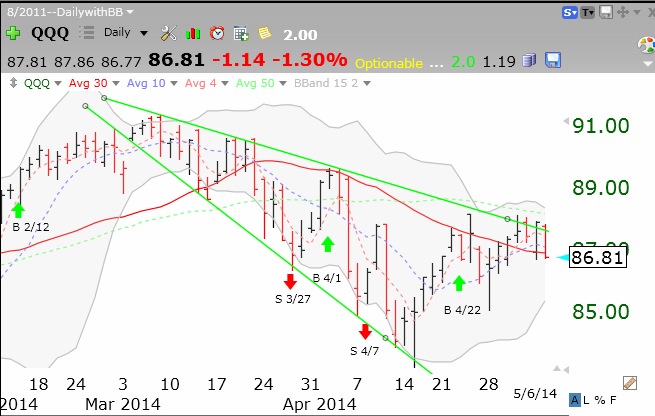
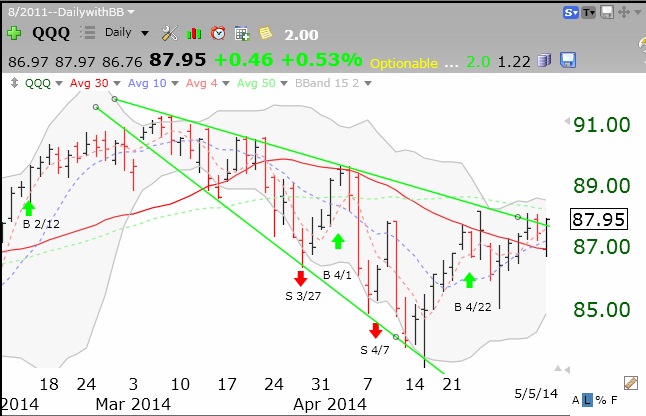
While my objective criteria for a short term down-trend have been met, I do not trust it. If you take a look at this daily chart you will see that each time the QQQ bounced from its lower channel trend line, it was also bouncing up from the lower Bolinger Band (BB). The space between the upper and lower bands is shaded gray in this chart. To me, the lower BB is a better indicator of potential support. So on Wednesday the QQQ bounced off of its lower BB, suggesting that we will now get a rise in the QQQ, but only to the top BB. We are headed for a BB pinch (thanks $Bill). At some point the BB will break up or down with a new move. I have also indicated before that I tend to trust a new short term trend only when it reaches day 5. Since 2006, 41% of short term down-trends lasted 5 days or less. So, even though the GMI remains on a Buy signal, I am waiting mainly on the sidelines until Mr. Market reveals his true direction. Click on chart to enlarge.