3rd day of $QQQ short term up-trend; $QCOR strong

GMI3/6
GMI-24/9
T210852%

Hard as it is to believe, the QQQ is still in a short term up-trend.   According to IBD the put/call ratio was 1.02 at Thursday’s close.   This is a contrary indicator. When the p/c ratio is greater than one it indicates option players are bearish.   When it gets to this extreme the market typically at least has a bounce.   A reading of 1.20 represents very extreme bearishness and is often followed by a rally.   We will have to see on Friday whether a reading of 1.02 is sufficient to turn this decline.

Meanwhile, I noticed strength in QCOR, which had a high volume green line break out to an all-time high about 5 weeks ago.   This weekly chart shows that QCOR is holding its own through this market weakness.   QCOR climbed 1.25% on Thursday. MNK is buying QCOR and shareholders will receive some payment in MNK shares.   With MNK rising, so does QCOR.
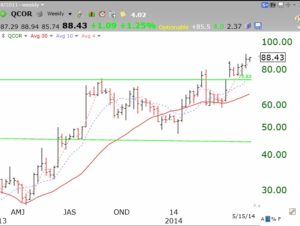
QCORwkly05152014

2nd day of $QQQ short term up-trend

GMI3/6
GMI-27/9
T210858%

Welcome to all of those who attended the U of MD. financial planner workshop on Wednesday.   You can find the list of the books I mentioned in my speech to the lower right side of this page.   For a quick review of my approach, please watch the December, 2012 video, link to the right of this post.

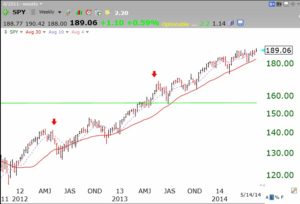
The SPY (S&P 500 ETF) remains in a longer term Stage 2 up-trend.   The weekly chart below shows the SPY to be rising nicely above its 30 week average (red line).

SPYwkly05142014

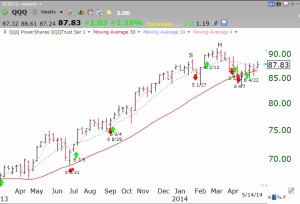
The QQQ (NASDAQ 100 ETF) is also in a Stage 2 up-trend, but is a little weaker than the SPY, as it is hugging the 30 week line. The green and red arrows on this chart represent the GMI buy and sell signals.

QQQwkly09142014I remain fully invested in mutual funds in my university pension.


New $QQQ short term up-trend

GMI5/6
GMI-28/9
T210862%

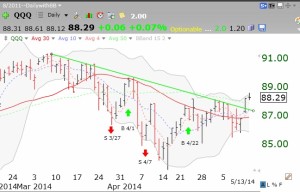
This daily chart shows that the QQQ is now above its descending trend line (green line).   However, as usual, it met resistance at the upper 15,2 Bollinger Band.   Today was the first day of a new short term up-trend within a longer term up-trend. Note that the 30 day average (red line) is starting to curve up, a sign of strength.   The GMI has turned 5 (of 6) and remains on the Buy signal triggered on April 22nd.

QQQdaily05132014