On the verge of a GMI Sell signal but markets becoming very over-sold; $AGIO rocks

GMI2/6
GMI-23/9
T210822%

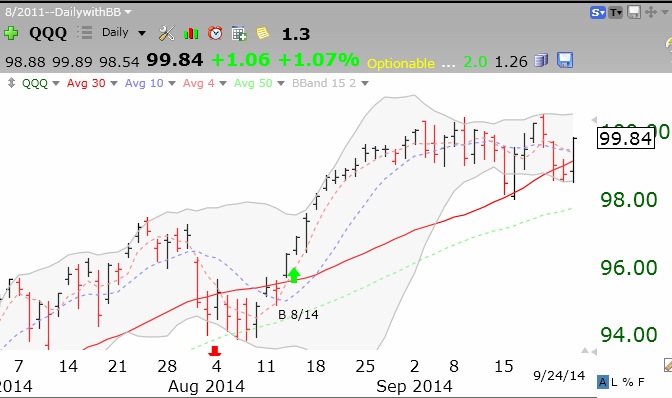
With the failure of Wednesday’s rebound, the indexes are likely to enter short term down-trends on Thursday.   This is the time to step away and watch from the sidelines. This daily chart of the QQQ shows it broke below support on the highest volume in months.

QQQdaily09252014

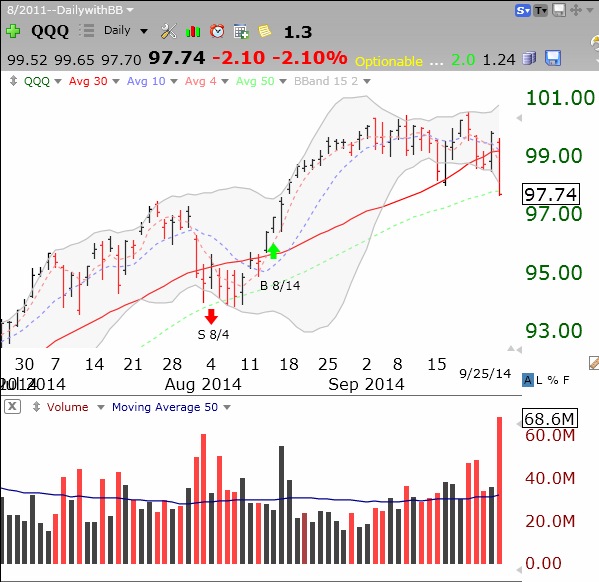
The longer term trend of the QQQ remains up, however. I have very small positions in my trading accounts.   My university pension remains invested in mutual funds for now. With the put/call ratio at 1.11 and the T2108 at 22, we could see at least a short term bounce very soon.

One recent green line break-out stock had a great day on Thursday.   Check out this daily chart of AGIO.

AGIOdaily09252014
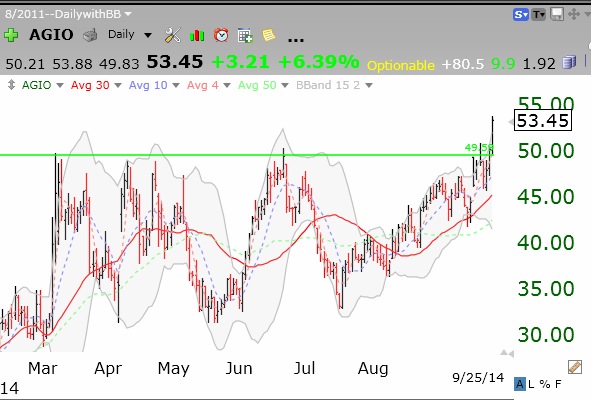
Now that is unusual relative strength!

GMI Buy signal and $QQQ short term up-trend hold–for now; New highs with good earnings: $SWKS, $UTHR

GMI3/6
GMI-26/9
T210830%

We went to the brink and turned back, so the up-trend remains intact. It is still a weak rebound, however.   There were only 40 new highs but 237 new lows on Wednesday.   Only 57% of all U.S. stocks rose, but 90% of the Nasdaq 100 stocks rose.   So this is yet again a lop-sided rally, primarily among growth and tech stocks.   This daily chart of the QQQ (Nasdaq 100 stock ETF) shows that it held its lower Bollinger Band and climbed back   above its 30 day average.

QQQdaily09232014

The GMI rose to 3 and therefore did not flash a Sell signal.   We will have to wait to see if this renewed up-trend can sustain itself.   I own a little TQQQ and will add to my position if the QQQ holds. Only two stocks came up in my scan for stocks at new highs with strong recent earnings—SWKS and UTHR. Both are above their green line break-outs. Check out these weekly charts.

SWKSwkly09232014

UTHRwkly09232014

$QQQ short term up-trend likely to end Wednesday; small caps entering Stage 4 decline

GMI2/6
GMI-23/9
T210826%

The SPY weakened on Tuesday as did the QQQ. The GMI could flash a Sell signal with another decline on Wednesday. Small stocks are about to enter a serious Weinstein Stage 4 decline, as shown by this weekly chart of IWM, the Russell 2000 Index ETF. In fact, IWM appears to have put in a double top. Note that the 30 week average (red line) is about to turn down. With the small cap stocks caving in, can the rest of the market be far behind?

IWMwkly09232014