Over the past year I have been whip-sawed by stocks, with my trading account value going to all-time highs and then giving back the advance. I recently became so tired of the market roller coaster that I took a vacation from the market and went to the sidelines. So I missed the recent bounce and served as a wonderful contrary indicator. In my defense, I had told you I expected a rally into earnings to be followed by a post-earnings swoon. I have small positions now in SQQQ (3X bearish bet on the QQQ) and I have bought a put option on the China market ETF, GXC.
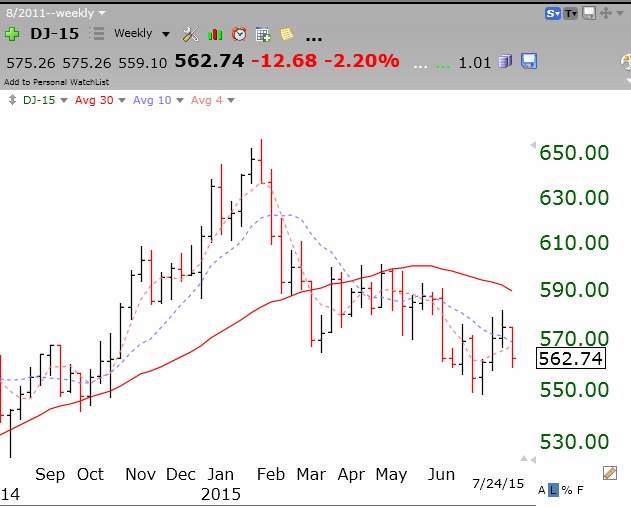
These actions all occurred before I spent some time looking over the market indexes this weekend. Now I am very concerned. As most of my long time readers know, I was out of the market and in cash in my trading and conservative pension accounts during the major declines in 2000 and 2008. (I did get back in after the bottoms were in.) The primary indicator that made me flee the market both times is based on Stan Weinstein’s Stage Analysis. When the market indexes enter a Stage IV decline I retreat. A Stage IV decline is defined as when the price of the stock or index is trading below its declining 30 week moving average. I begin to take special notice when the DIA, SPY or QQQ close below this critical average. The DIA and SPY are now below their 30 week averages and while the QQQ is above its 30 week average, it may have experienced a failed break-out (head fake) last week that will lead to a significant decline below its 30 week average. I begin to exit the market in my most conservative pension accounts when the 30 week average starts to curve down. It has not done so yet, but it is looking ominous. Here are the weekly charts of the three ETF’s I monitor for the major indexes. The solid red line is the 30 week average.
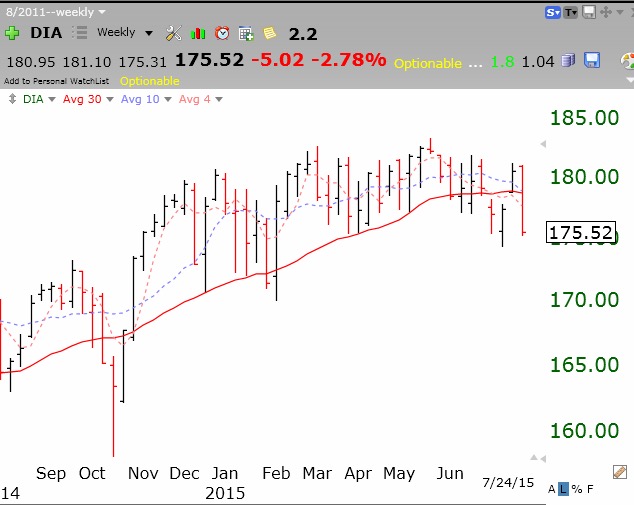
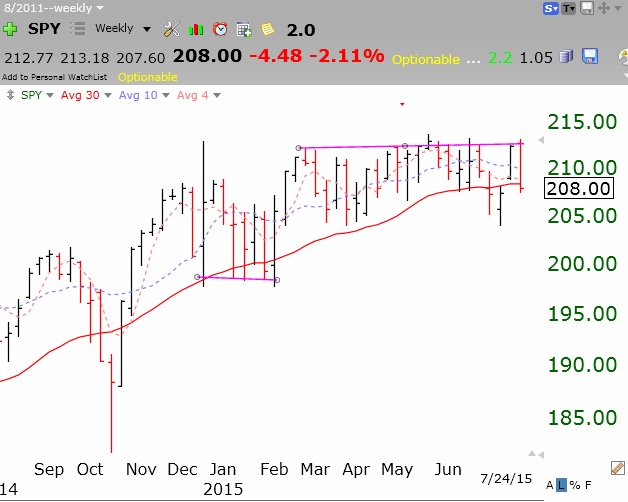
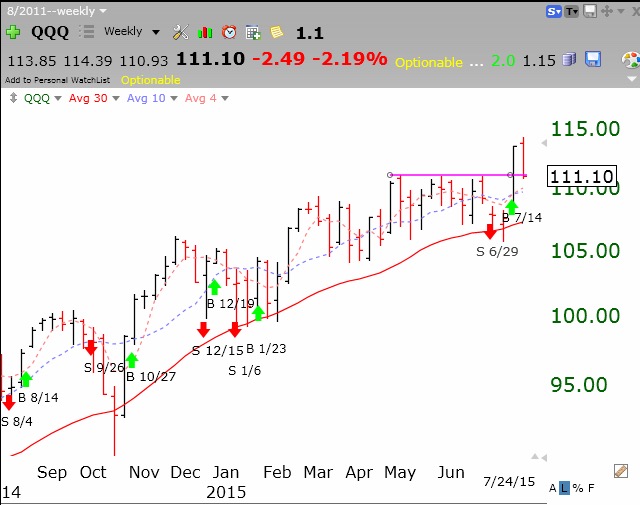
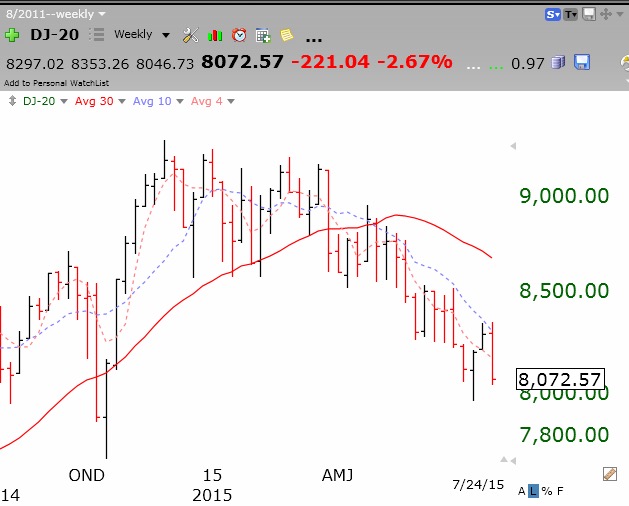
Note that all 3 indexes traded below their 30 week averages recently and then climbed back above it. But both the SPY and DIA have now closed back below it, a critical sign of weakness. I have been writing all week about the fact that the QQQ looked strong because of a few big name stocks, but that most stocks were breaking down. The big transportation stocks and the utilities are already in solid Stage IV declines:
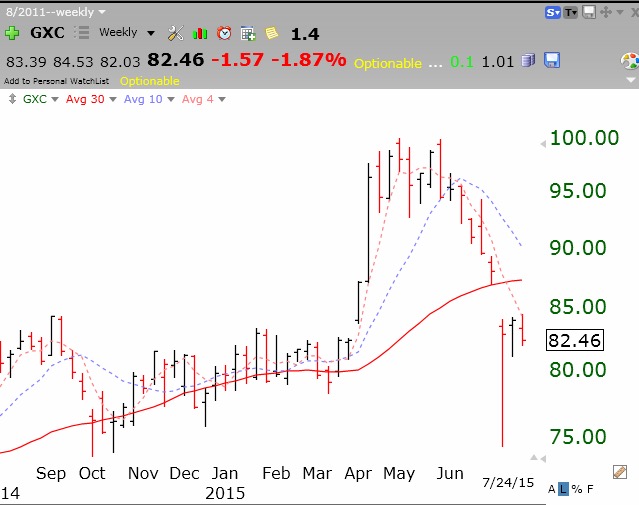
 And then there is the China market ETF, which is not in a Stage IV yet, but is now bouncing from a major decline. This market should at least re-test the recent lows, which may or may not hold. A weakening Chinese economy is being blamed for much of the worldwide declines in commodities, which in itself is disconcerting.
When I look at these charts of the U.S. market indexes and then at the number of key individual stocks in Stage IV declines, I am reluctant to stay long in this market. By my count, on Friday where were 7x more new yearly lows than new highs! I have to look at how the market is behaving, not at what the market pundits say.
Once earnings season is over there is little to propel this market higher— and then there is the Fed. Over my 50 years studying the market, I have learned that when the Fed wants to raise interest rates the market often falls. And with so many boomers near retirement, many will exit when stocks fall and they seek out alternative safer income producing instruments (even savings accounts) that become available as interest rates rise. This time could be different, but I doubt it. Past performance does not necessarily predict future results, but each of us has to find a way to protect our life’s savings……
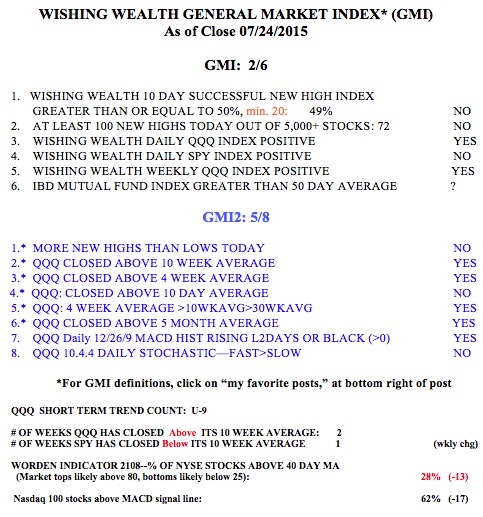
Meanwhile the GMI is at 2 or 3? (of 6) and could signal a Sell if Monday’s markets are weak. I cannot tell from the chart if the IBD fund index is above its 50 day average (GMI component 6). IBD has now called the market uptrend under pressure, yet again. It is also noteworthy that the two 3x ETFs that climbed the most on Friday were gold miners, JNUG (+17%) and NUGT (+10%). If this market plummets we could see a flight to gold and U. S. treasury bonds.
Just add T2118, McClellan Summation Indicator, it is falling which is negative for long stocks.
I am in Greek stocks (they will/should/might go up again from their present low) and SDOW, the 3 beta DJ-30 bear ETF. Otherwise 80% in cash.
Your general analysis appears correct.
Would you post the guppy charts for Spy,Nasdaq and the bio-tech indices?