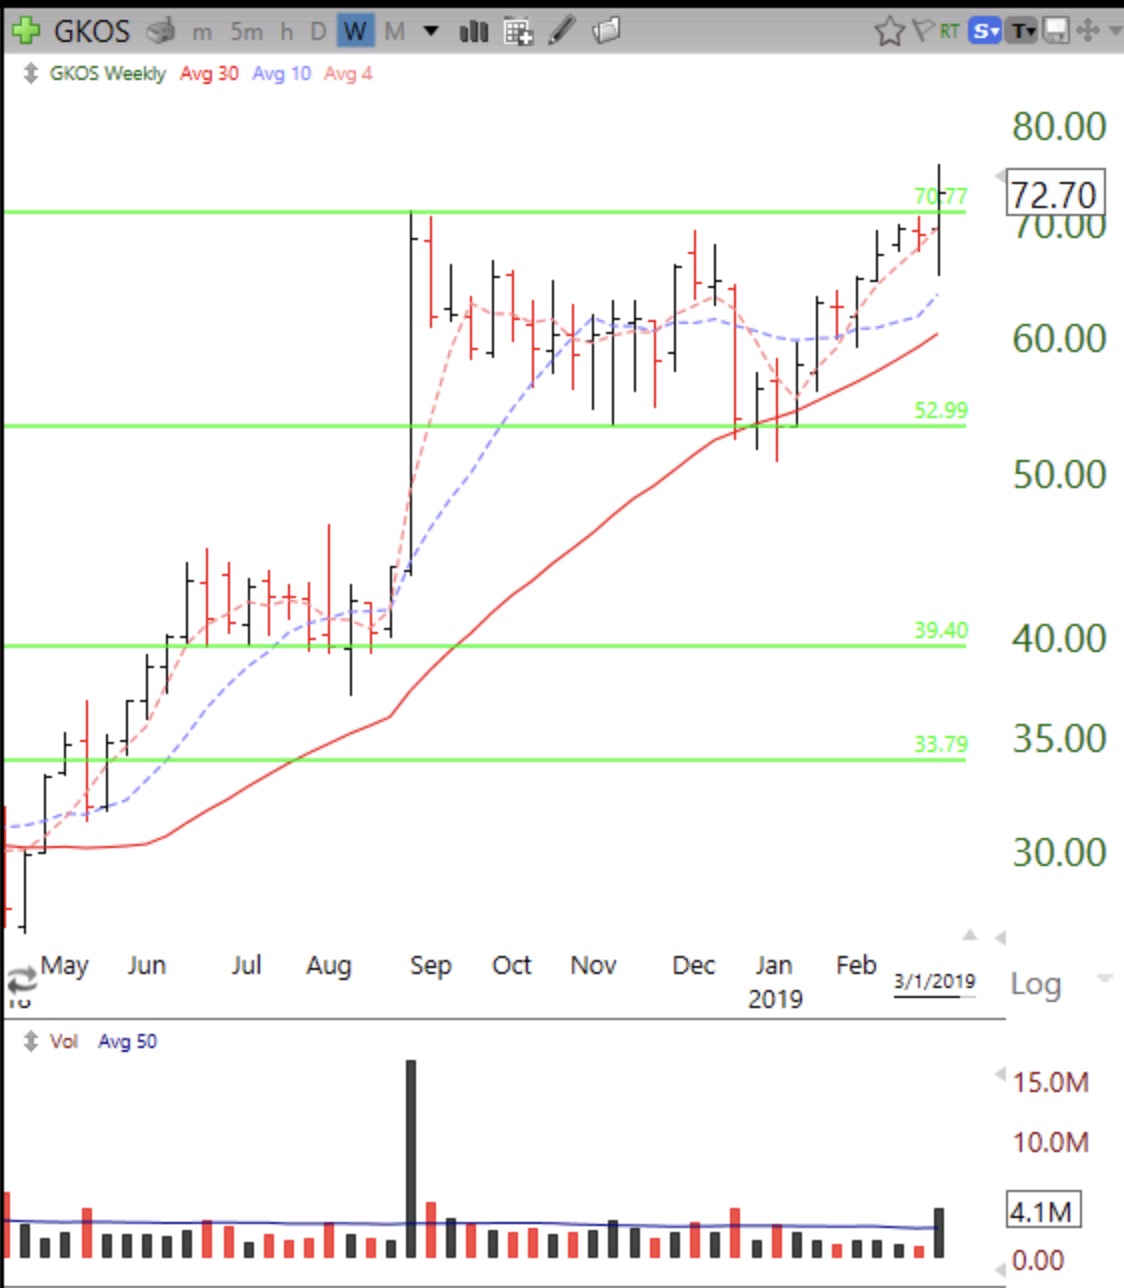
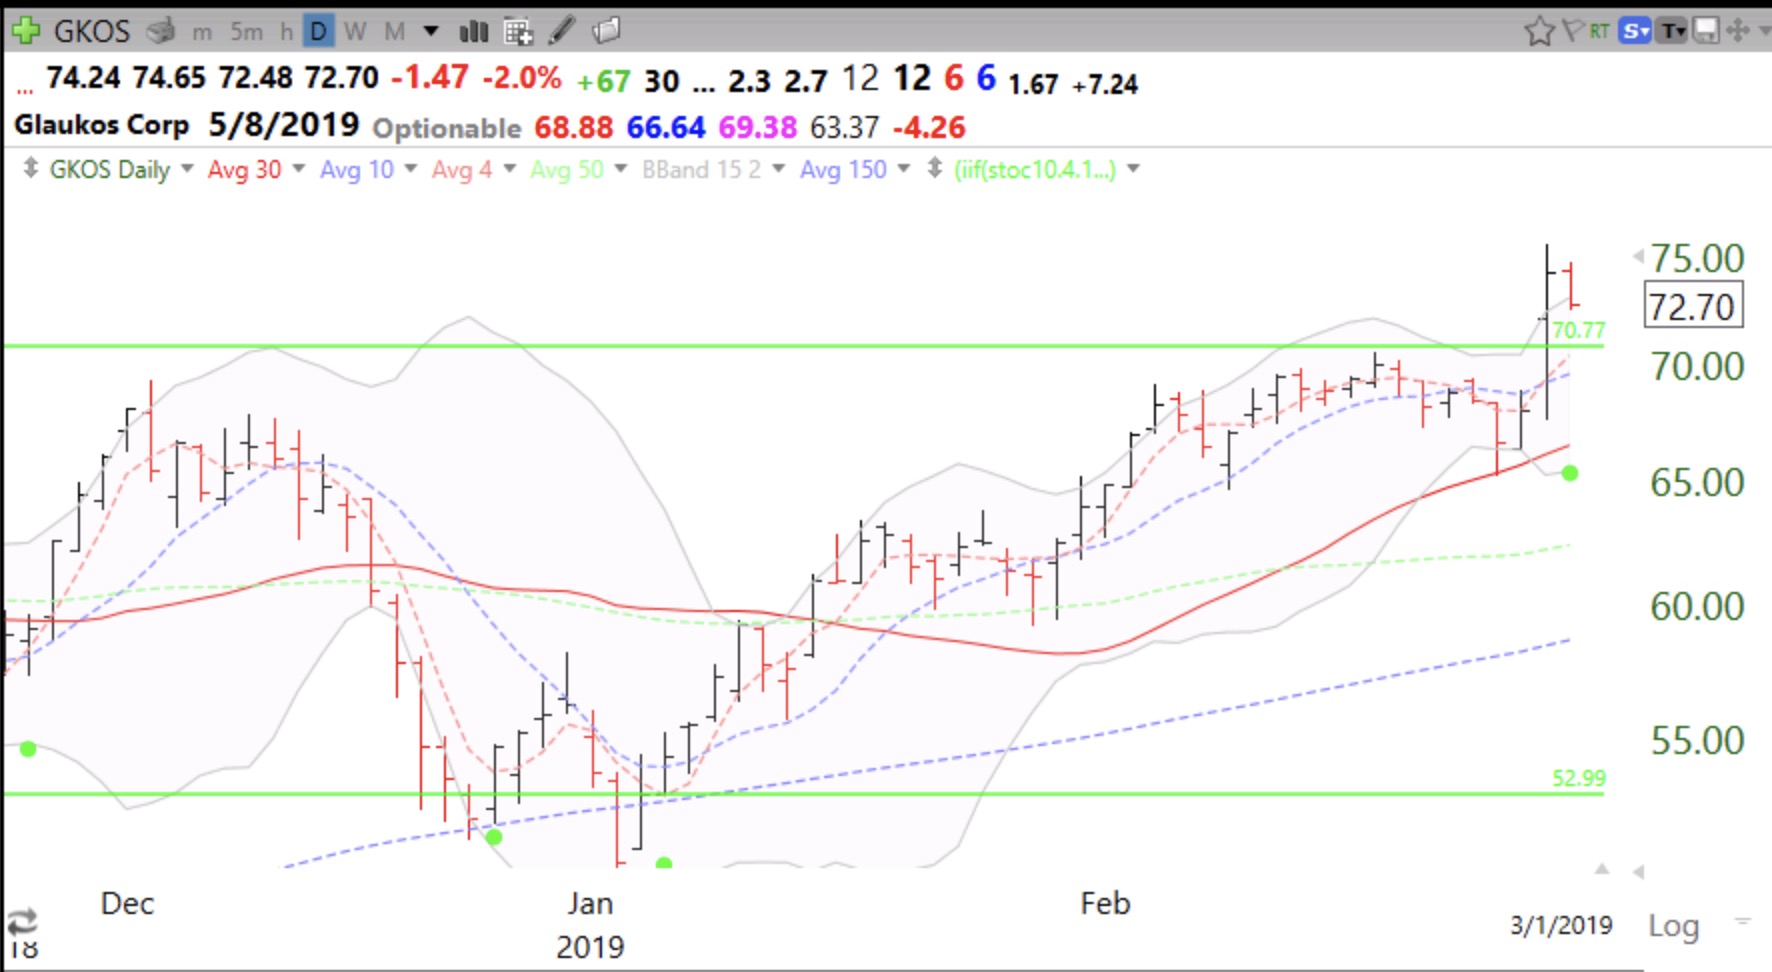
I like to find recent GLB stocks that have a green dot signal. I am focusing on very strong stocks near their ATH and in an up trend that have an indication of a short term bounce (green dot). The weekly chart below shows the nice long term set-up of GKOS. It is clearly in a Stage II up-trend and has been consolidating after a huge week last August. The daily chart shows the green dot set-up. In addition, the stock has recently bounced up from its lower 15.2 daily Bollinger Band. GKOS is starting to report profitable quarters. If I bought GKOS my sell stop would be below the low of the recent bounce. I also might sell sooner if it closed back below its green line. You can find a video for adding green dots to your TC2000 charts at my TC2000 club.