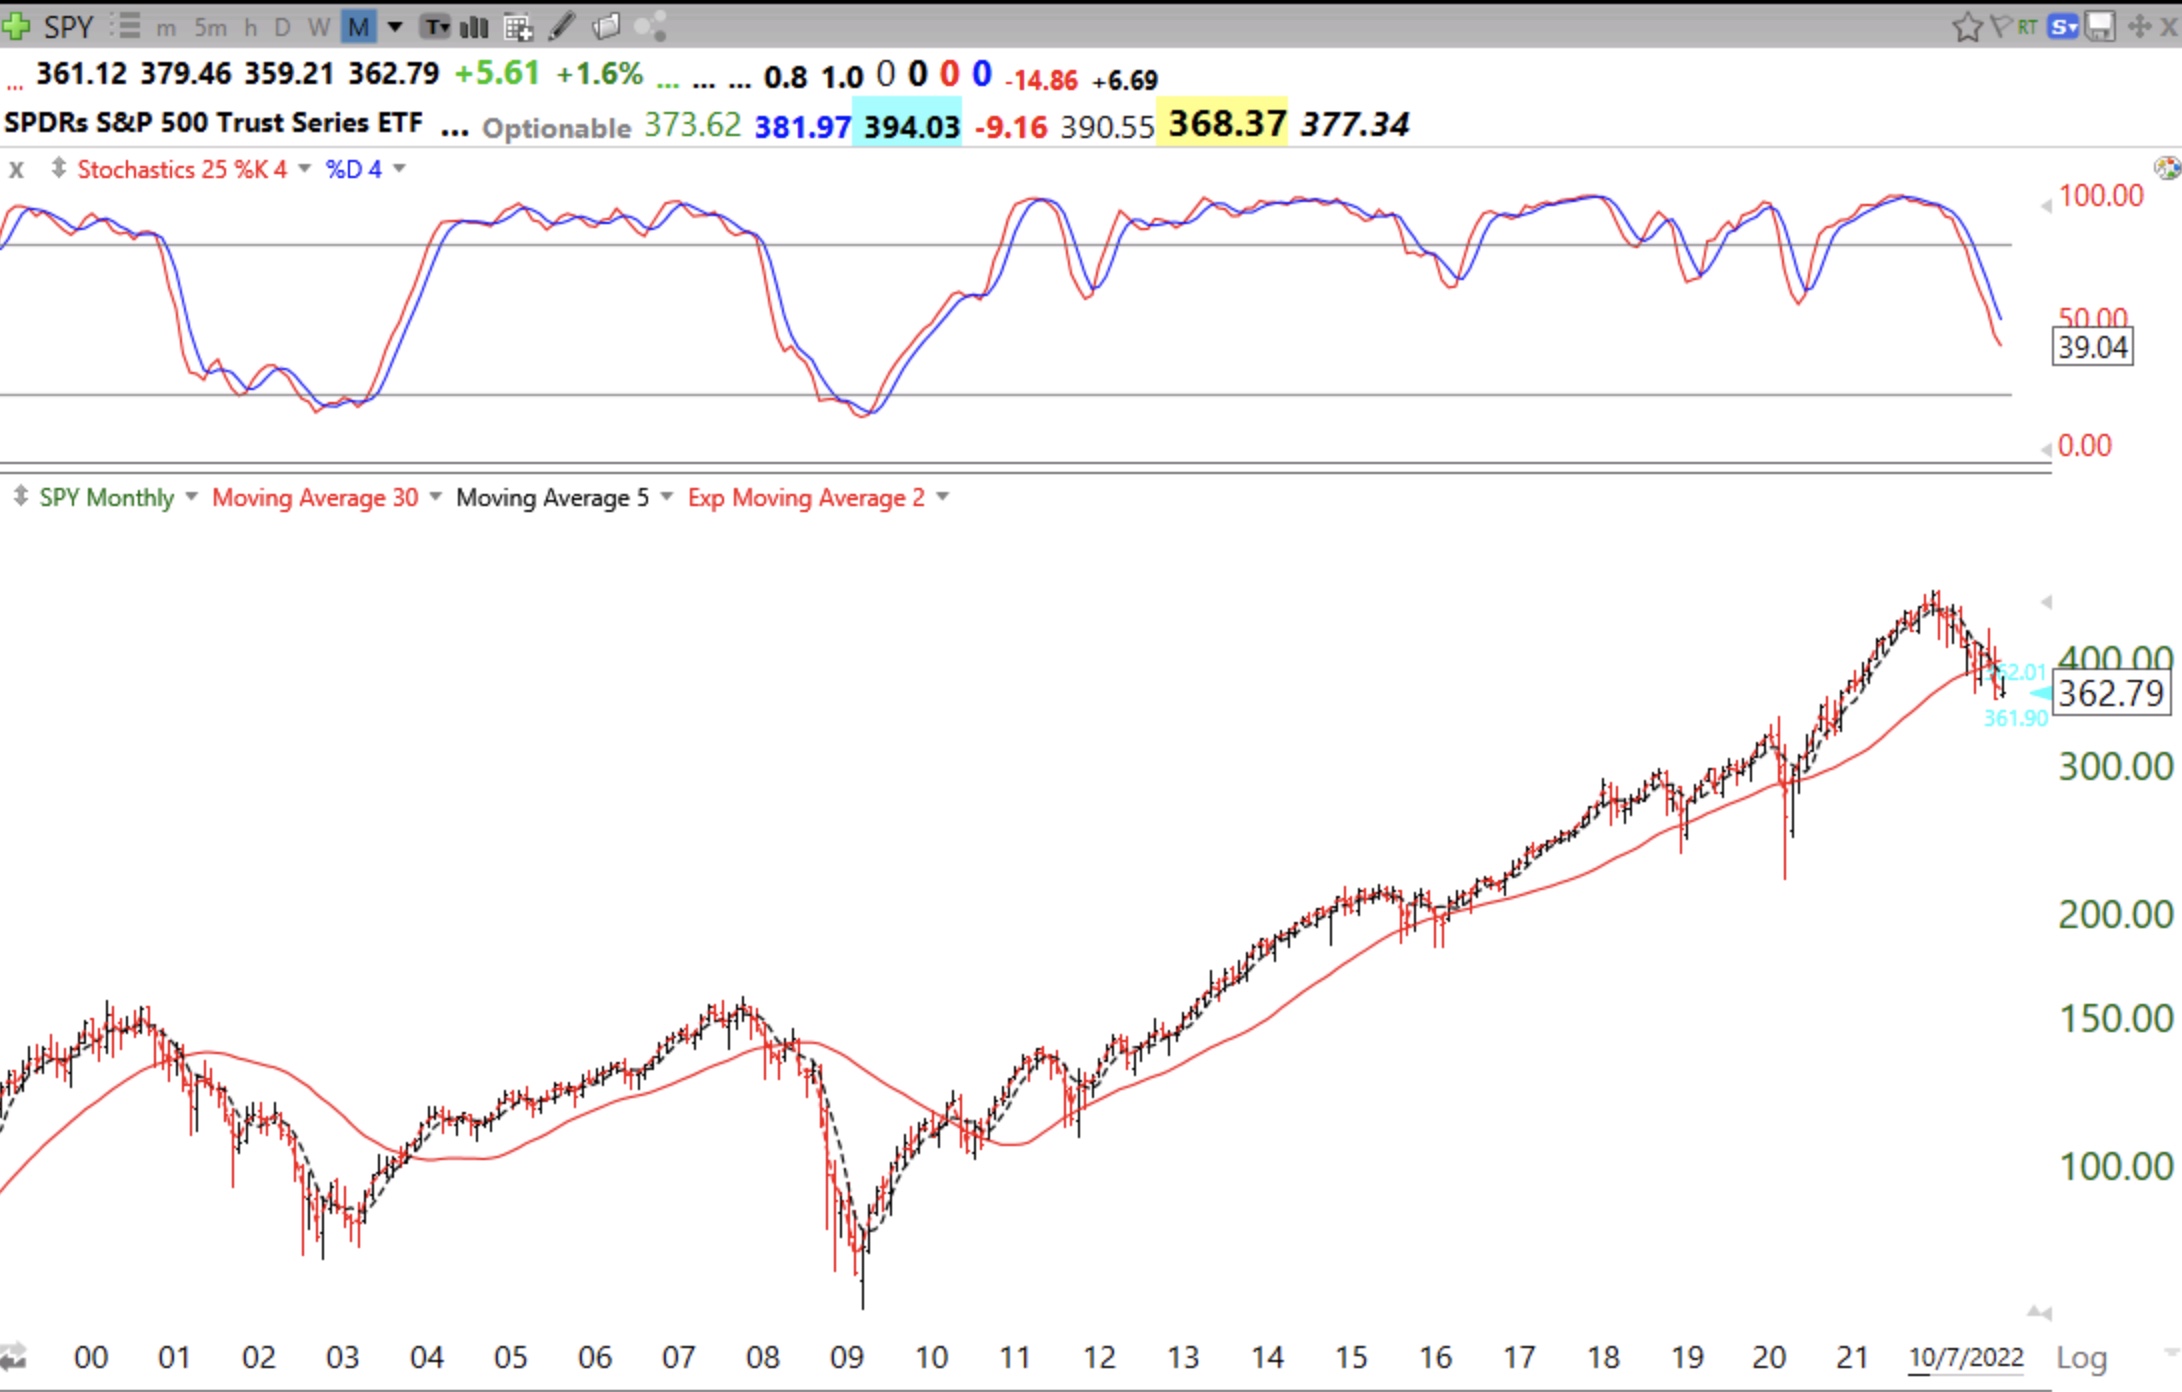
This is a monthly chart with a 25.4 and 25.4.4 stochastic. The 25.4 stochastic is currently at 39.04, but the 2003 and 2009 bottoms occurred with readings below 20. This down-trend actually appears minor compared with those declines and may have a ways to go. Why try to guess a bottom or catch a falling knife when one can rest calmly on the sidelines? This chart shows that there are years to ride the new bull after a new up-trend has been established.
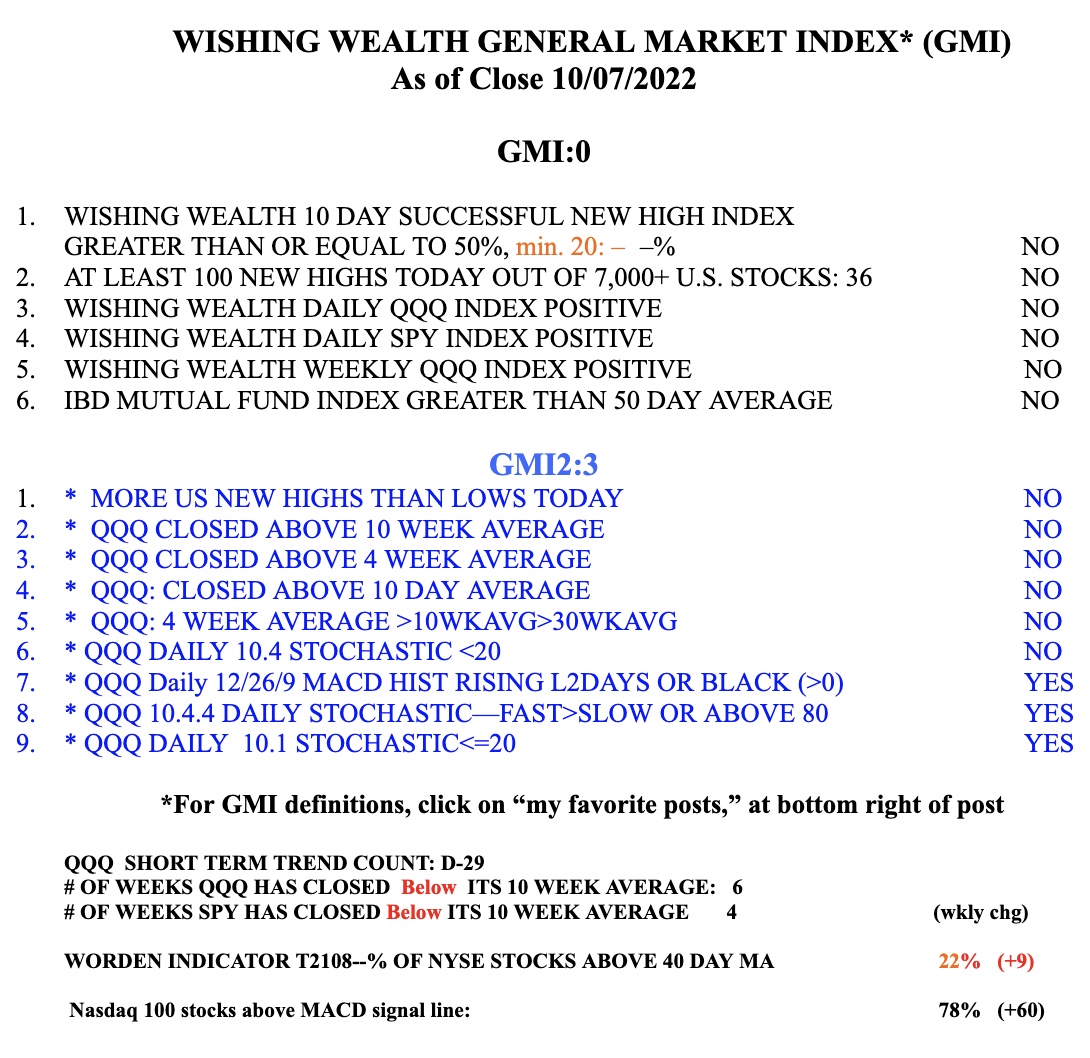
The GMi is back to 0 (of 6) and on a RED signal.