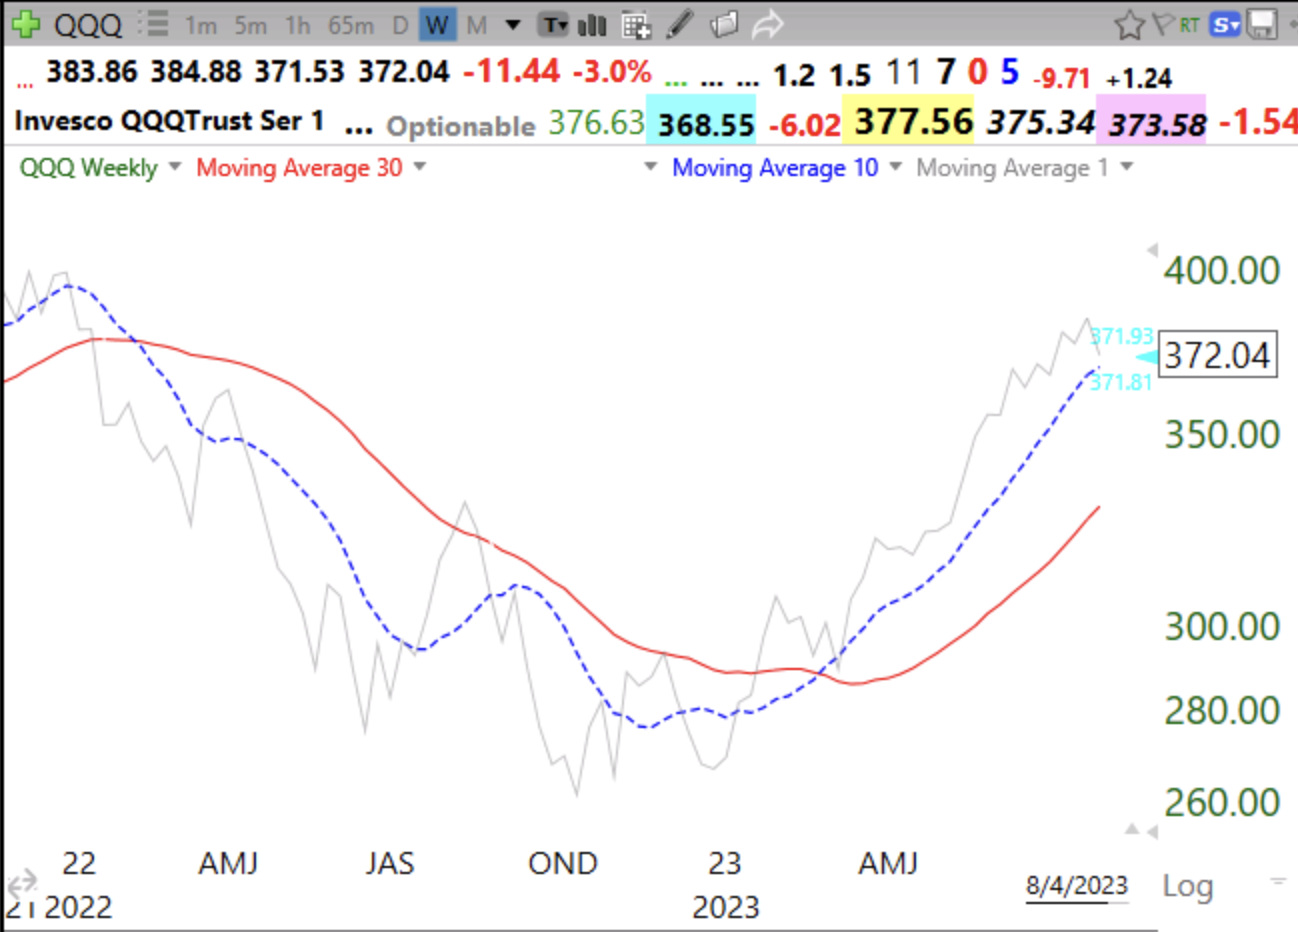
Another flat or down day for QQQ on Monday will end the QQQ short term up-trend after 68 days. But about 40% of QQQ short term down trends end in 5 days or less and QQQ’s longer term trend remains up. This 10:30 weekly chart shows that QQQ is in a strong longer term up-trend with the 10 week average rising above the rising 30 week average for its 23rd week. I would become more defensive if the weekly close (gray line) should decline below the 30 week average (red line).
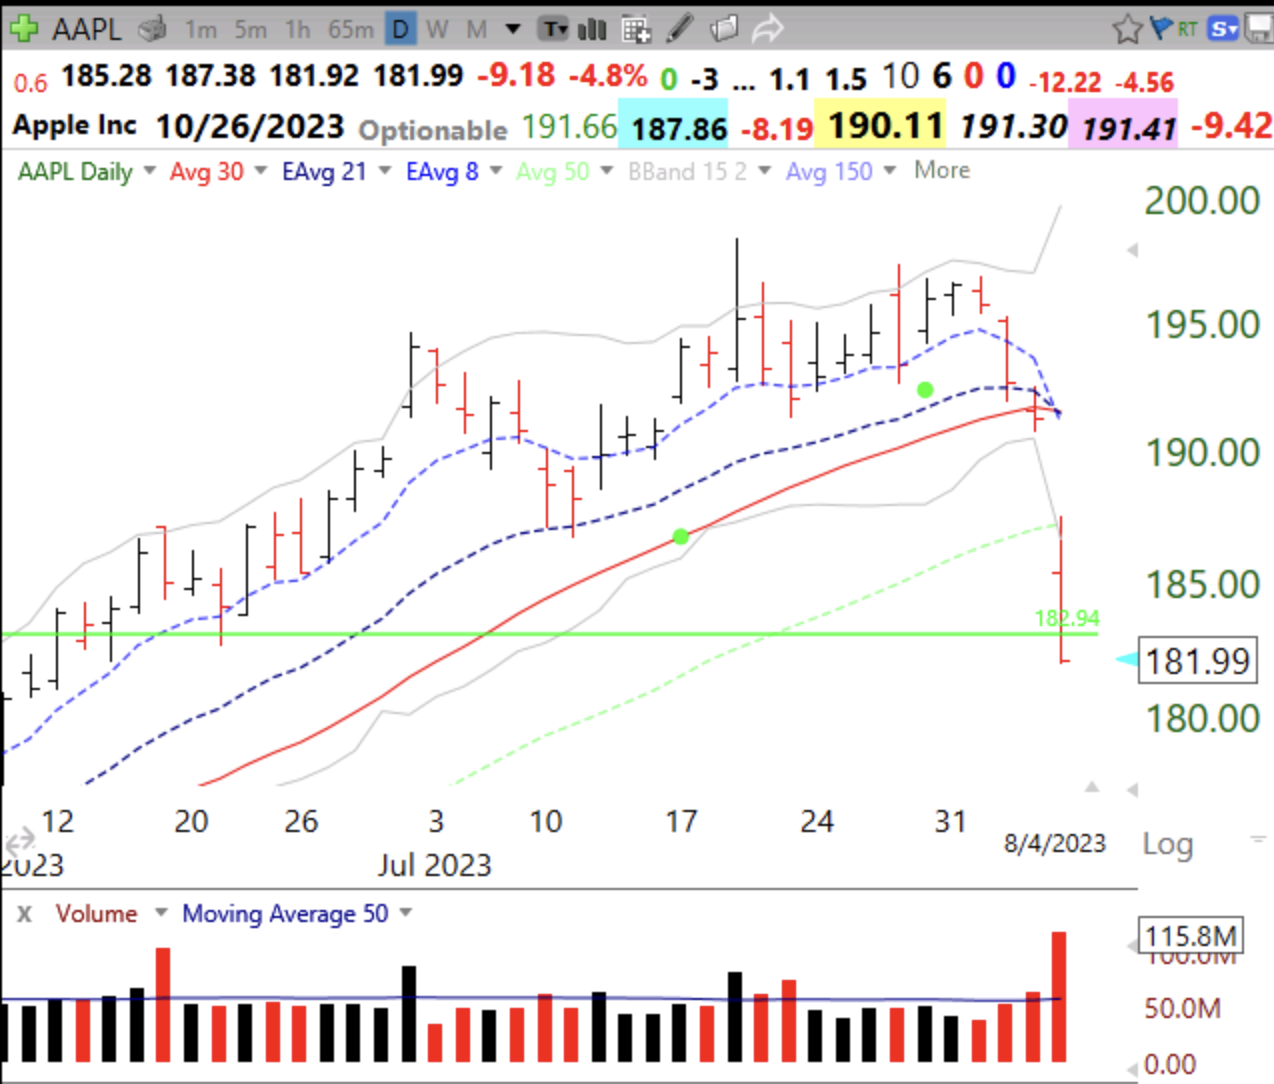
It is disconcerting that AAPL failed its GLB (green line break-out to ATH) on above average volume on Friday.
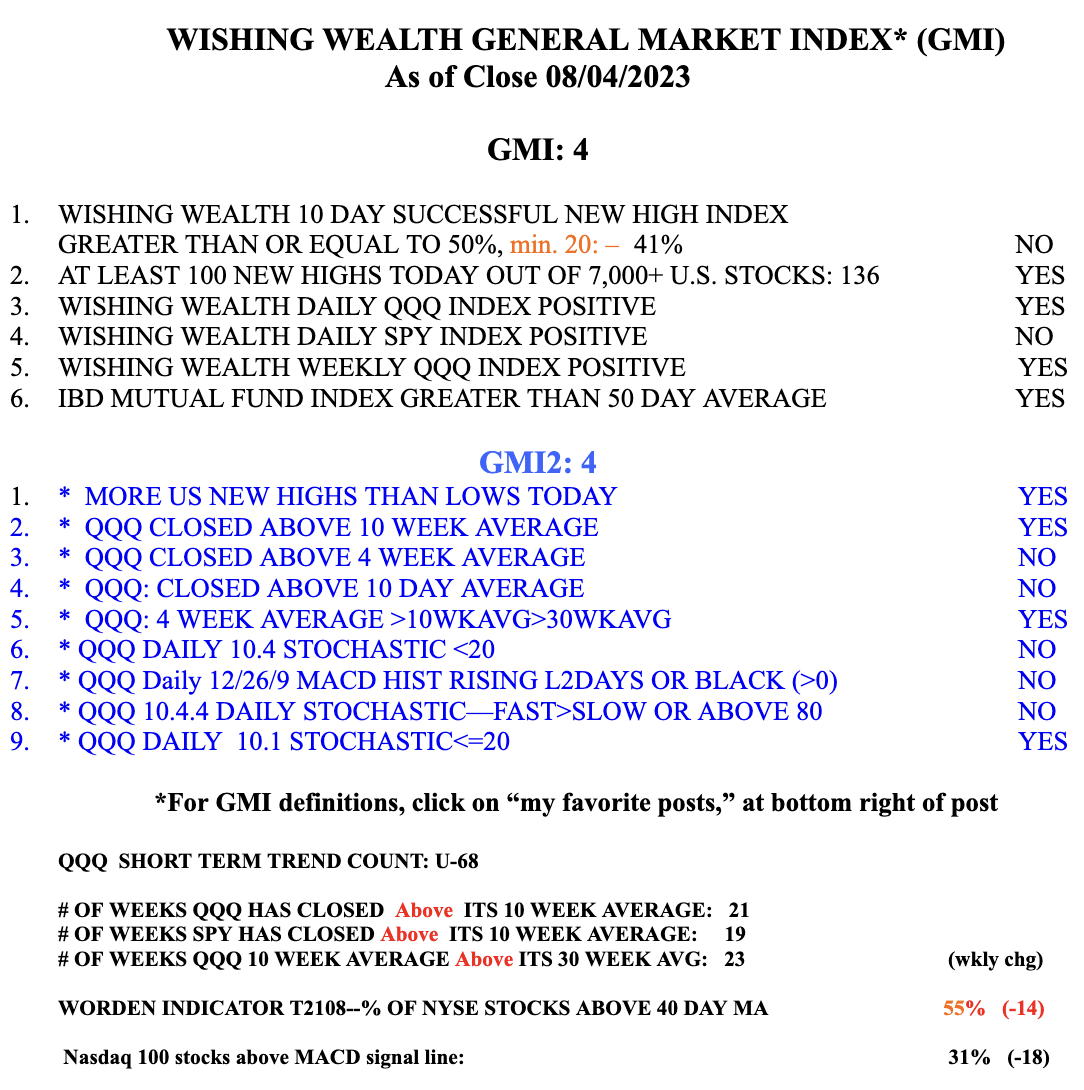
The GMI has now declined to 4 (of 6).
Thank you for your blogs, tutorial archive and videos! Based on GMI and market trends, you mention when you are timing buying or selling of mutual funds in your university retirement account. Please tell use more about in what kind of, or which, mutual funds you invest. Index funds? Sector funds? Bond funds? Other?