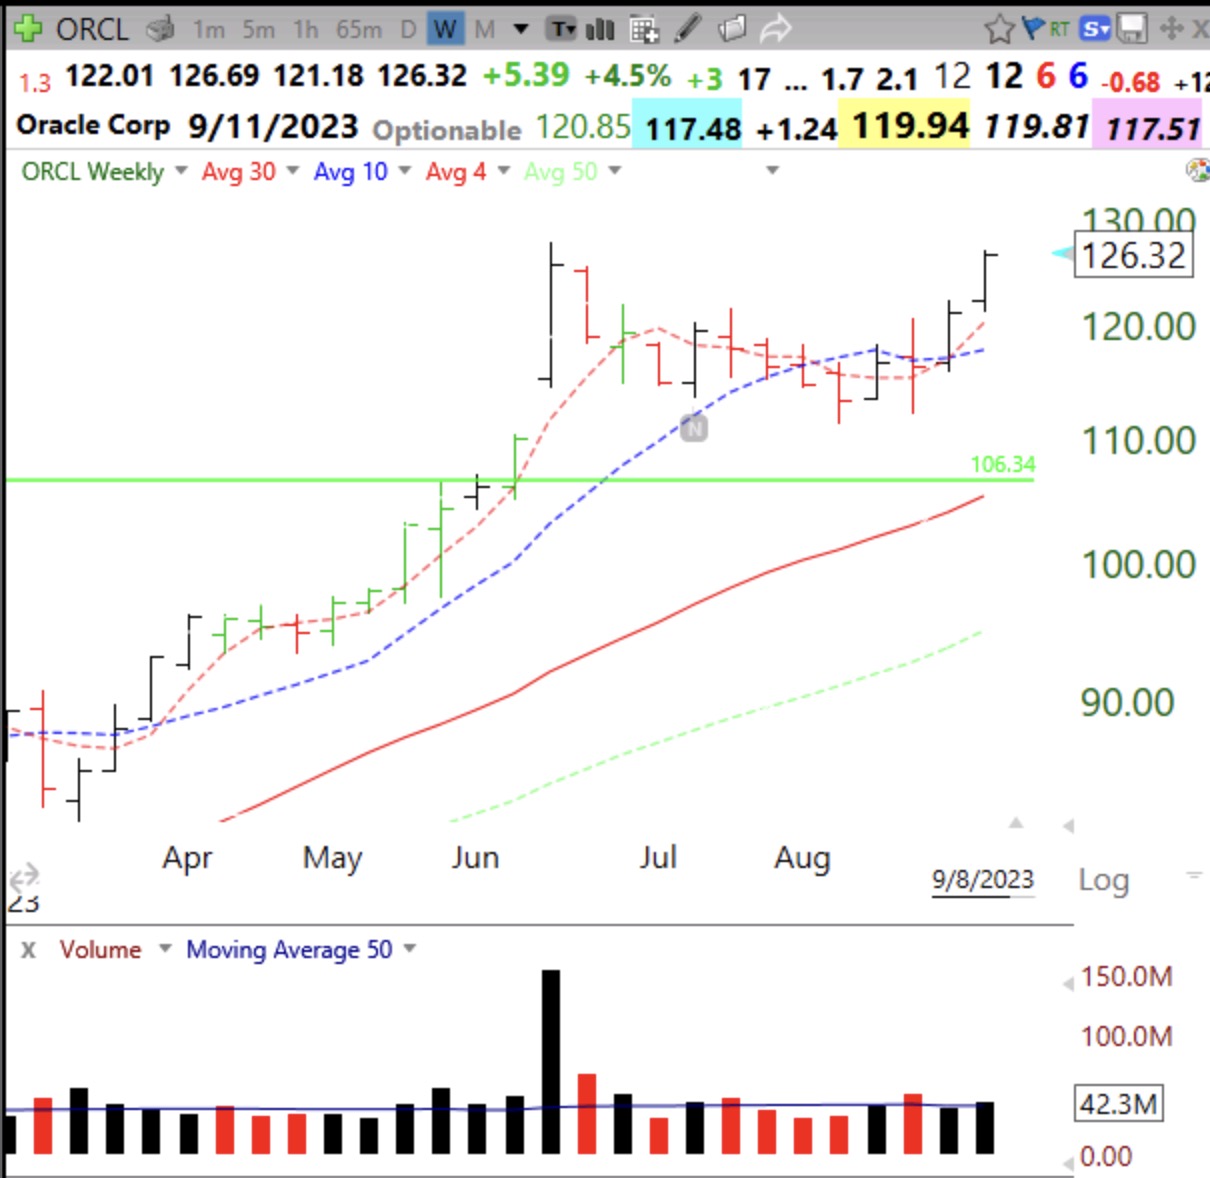
ORCL had a GLB (green line break-out) to an ATH (all-time high) in June on above average volume. It has then consolidated for 12 weeks. On Monday it will report earnings and a rise above 127.54 with above average volume to an ATH would be worth monitoring. ORCL has already doubled its yearly low and MarketSmith indicates it has a comp rating=95 and RS=96. See weekly chart below. Two weeks ago ORCL bounced up off of its 10 week average (purple dotted line). Note that its 4wk avg>10 wk avg >30 wk avg, a sign of a powerful Stage 2 up-trend. When I miss a GLB, I may look to buy after a bounce up off of the 10 week or 4wk average. Study this chart for these set-ups. A green bar on this chart shows a bounce up off of a rising 4 week average that is also above its 10 week average which is above its 30 week average (30 week average is solid red line).