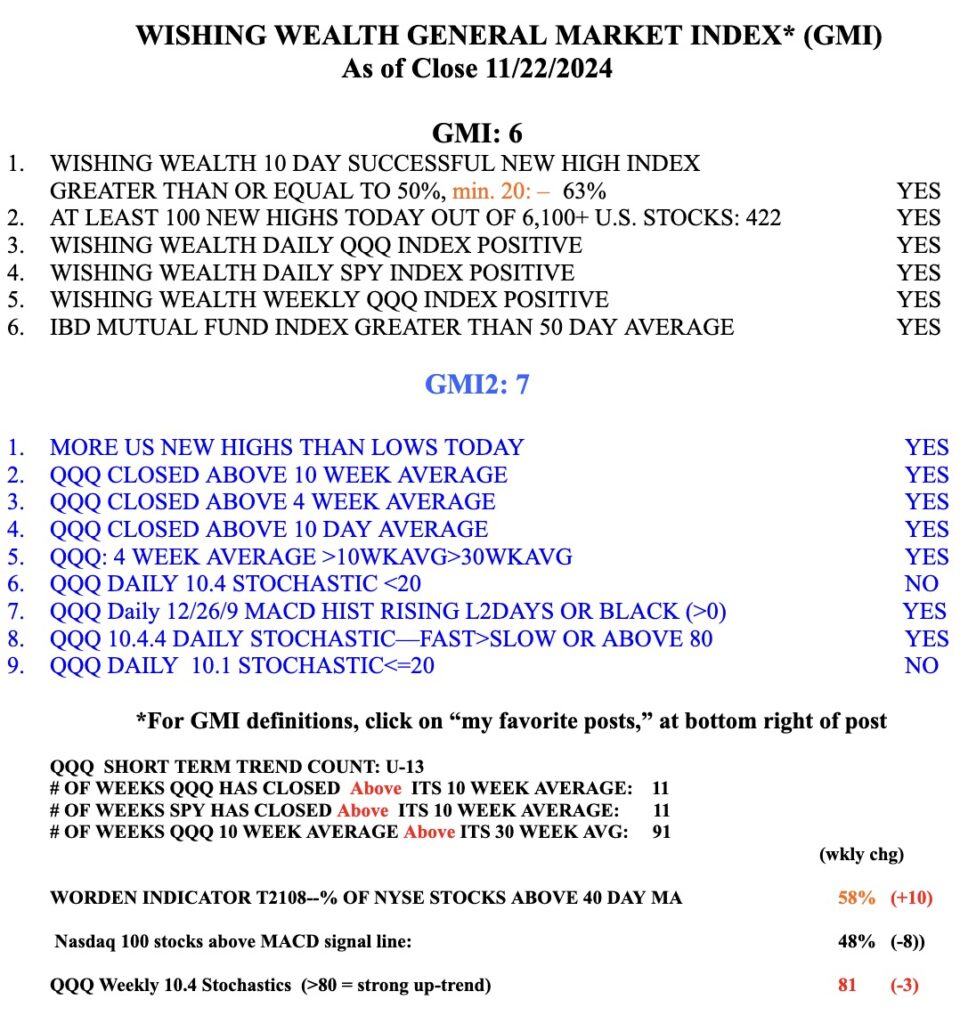
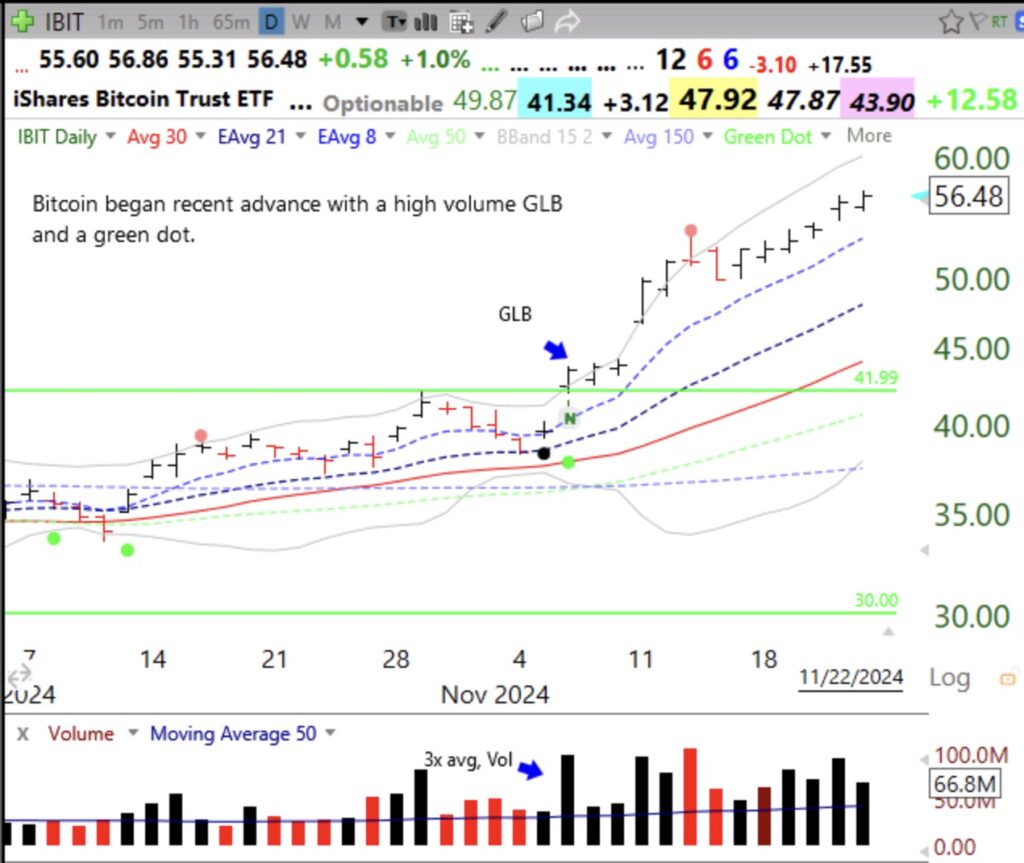
The start of the recent advance in bitcoin was marked by an unusually high volume green line break-out (GLB) and a green dot showing a Stochastic 10.4 and 10.4.4 crossover. I noted when it happened that it looked like a promising “flag” pattern, see monthly chart. The “N” designates a note I entered in TC2000 on the daily chart.


What is the lower green bar at $30 for? thanks!