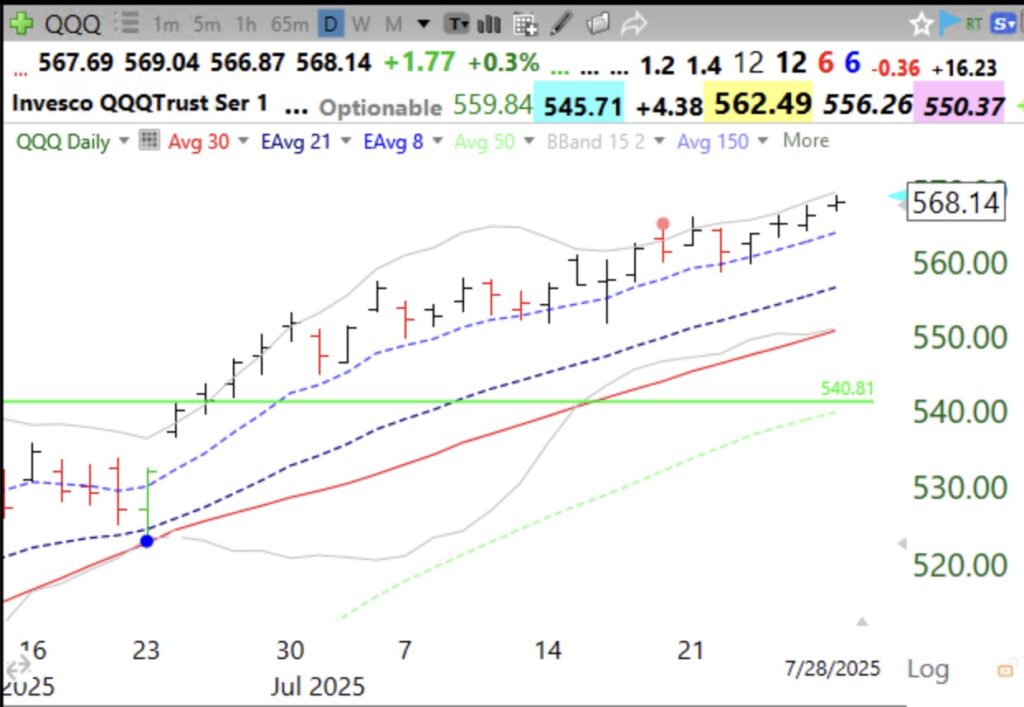
The blue dot also occurred with a bounce up off of the 21 EMA and the lower 15.2 Bollinger Band. I suspect that when QQQ does finally close below its daily 8 EMA it will signal some short term weakness in the up-trend. Note the possible tradable buys when QQQ bounced up off of its 8 EMA. My TC2000 scan finds such occurrences. When Richard Moglen and I create our online Mastercourse, these setups will be built into Deepvue. Stay tuned here to receive course announcements….
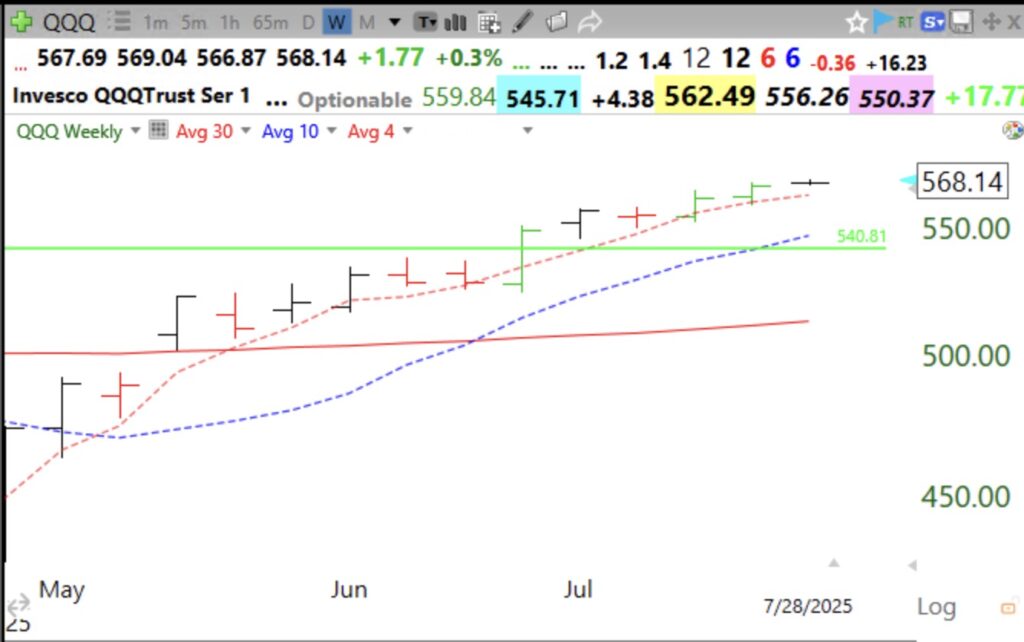
As I said in my TraderLion presentation, an equity tracking the daily 8 EMA often tracks the 4 wk moving average, see weekly chart. Red dotted line is 4 wk avg.