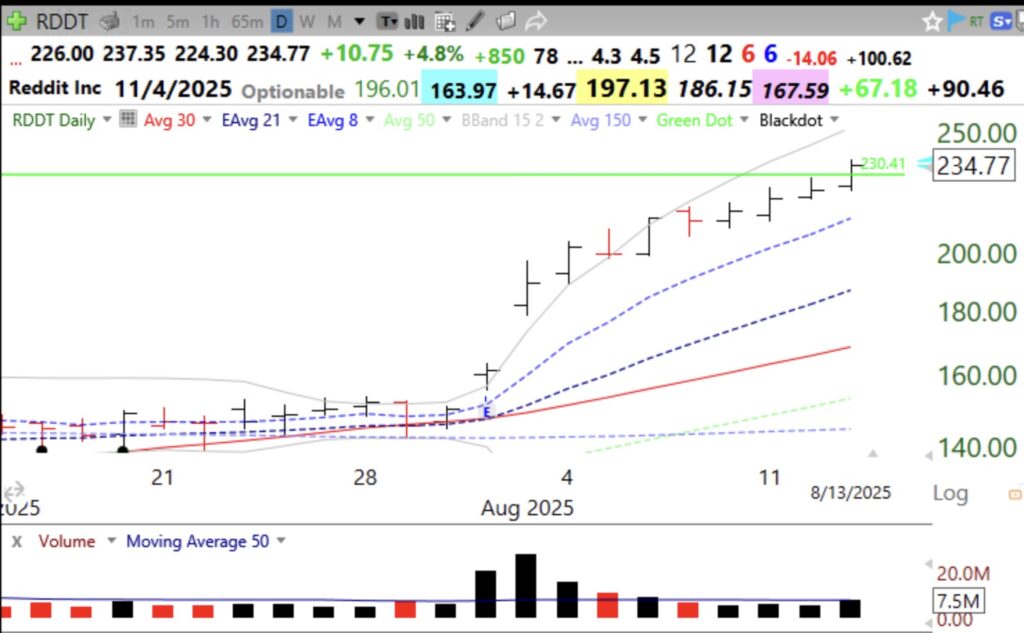
Daily chart. RDDT began ths rise with a gap up after earnings. I would like to see more volume on today’s GLB. A CLOSE below the green line at 230.41 would be a failed GLB.
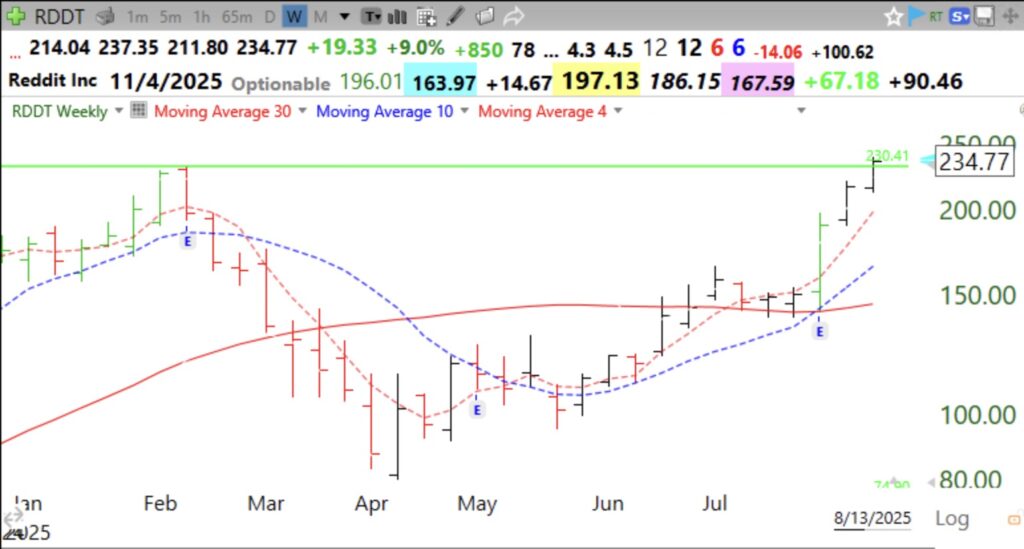
Weekly chart. Note moves after each quarterly earnings report is released.
Stock Market Technical Indicators & Analysis
Daily chart. RDDT began ths rise with a gap up after earnings. I would like to see more volume on today’s GLB. A CLOSE below the green line at 230.41 would be a failed GLB.
Weekly chart. Note moves after each quarterly earnings report is released.