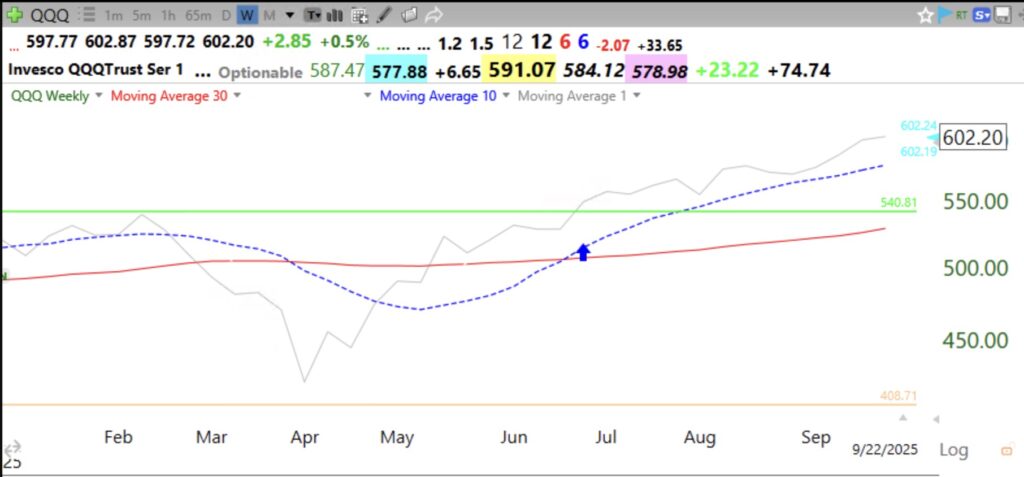
This chart shows the weekly closes (gray line) above the rising 10 week average (blue dotted) which is above the rising 30 week average (red solid). As long as this pattern continues I will stay long. When it fails I will reduce long holdings. I react rather then try to predict. No one knows when a rise will end. And I can exit after a top is evident from the indicators. Stop listening to the media pundits and instead watch the the market’s movements. If one gets out with a close below the 30 week and back in when it retakes it, it can work well. Look at this chart.