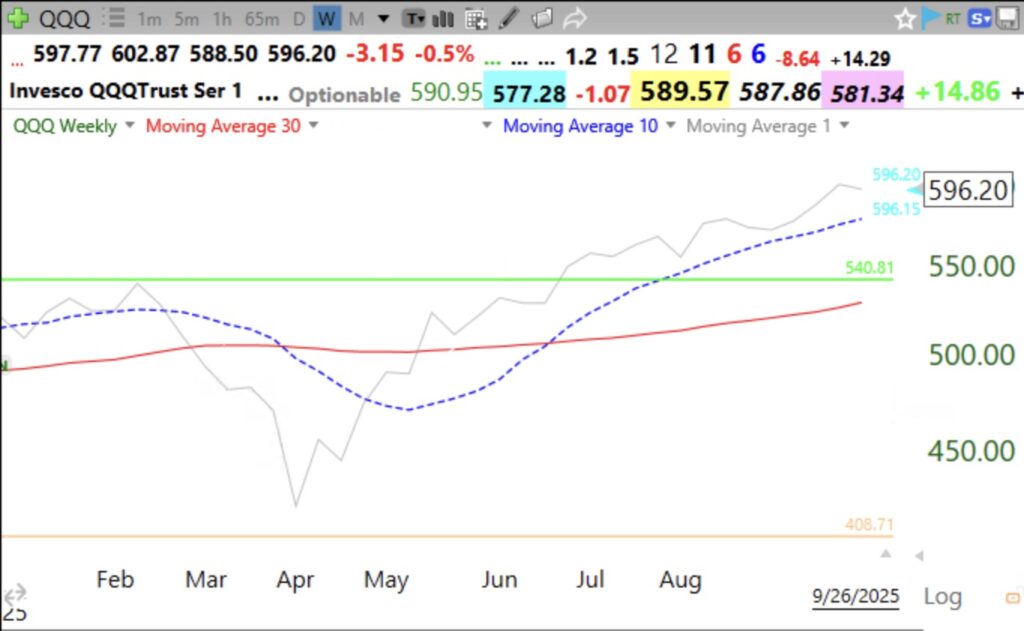
This chart shows the 10 week average above the 30 week and QQQ (gray line) is leading both higher. I ignore the news and just watch the market’s action.
Stock Market Technical Indicators & Analysis
This chart shows the 10 week average above the 30 week and QQQ (gray line) is leading both higher. I ignore the news and just watch the market’s action.