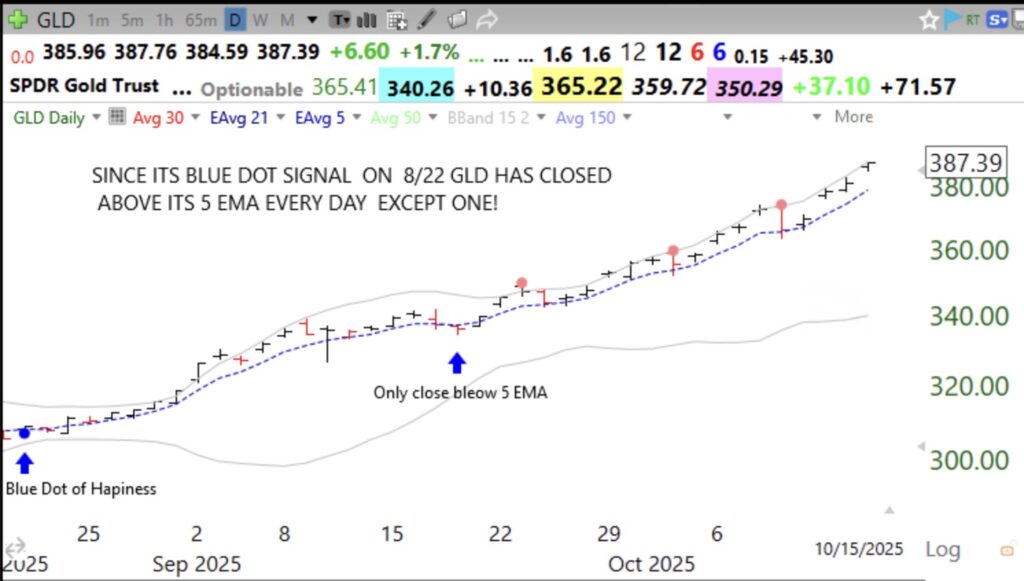
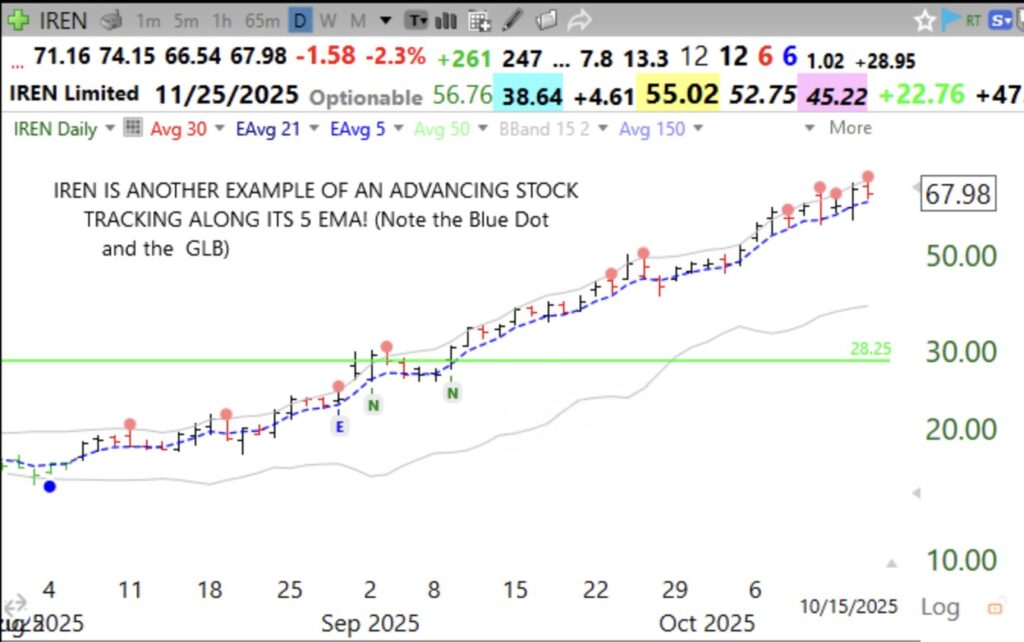
I saw it, but missed trading $GLD after it had its Blue Dot of Happiness signal on August 20. Two days later, on August 22, it climbed above its daily 5 EMA (exponential moving average) and has only closed below it once. One could have bought GLD on any of the bounces up off of the daily 5 EMA and profited greatly. During my recent TraderLion Conference talk on Day 6, I described the Blue Dot of Happiness signal and how I was using the 8 EMA. I have since found the 5 EMA to work even better for many rising stocks. Add the 5 EMA to your daily charts and see how many times advancing stocks bounce up off of this EMA. Note how GLD has traded between the 5 EMA and its upper 2.15 Bollinger Ban for the entire time. If I owned GLD I would become defensive the first day it closes below the 5 EMA. With this chart in mind, you too could create rules to trade GLD and other stocks showing this pattern. In addition to the chart of GLD, I show as an example, a similar pattern in IREN, which I successfully traded. I am not suggesting anyone should buy these stocks now, but only to learn this pattern and find other stocks beginning to track along their 5 EMAs. Why this can work, I do not know, or care. I have been using TC2000 to scan for rising stocks reaching ATHs and tracking with their rising 5 EMAs and bouncing up off of them. When I buy after a bounce, I immediately place a sell stop below that day’s low. Good Luck!