GMI: 0; GMI-R: 0; 23rd day of QQQQ down-trend; masochists and gamblers stay long

The GMI and GMI-R are both back to zero.  Tuesday was the 23rd day in the QQQQ short term down-trend.  As bad as it looked, there were only 50 new lows in my universe of 4,000 stocks, compared with 1,453 on January 22nd.  So the damage on Tuesday was not nearly as great as that a few weeks ago. There were 13  new highs in my universe of 4,000 stocks on Tuesday.   The Worden T2108 indicator is now back to 38%, well above bottoming territory.  Only 25% of the Nasdaq 100 stocks closed above their 30 day averages.

The down-trend continues and we should not try to guess a bottom.  We are only about 13 weeks from the top, and down-trends often last 9-12 months.  The key is to wait for a convincing turn before going long again.  Only masochists and gamblers hold stocks at times like these.
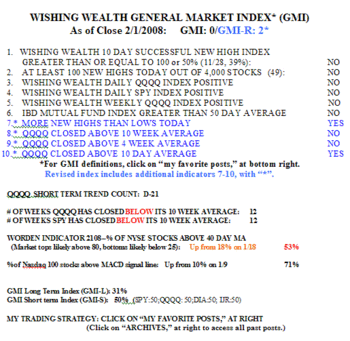
GMI: 0; GMI-R: 2; Worden T2108: 53%; Still in a down-trend but will rebound hold?

The GMI remains at zero (out of 6) but the GMI-R has risen to 2 (out of 10).  The GMI-R adds four short term sensitive indicators to the six indicators counted by the GMI. Gmi0201  Thus, while some short term indicators in the GMI-R have turned positive, the original GMI indicates that the market, especially the Nasdaq 100 index, remains in a down-trend.  On Friday there were only 49 new 52-week highs and 26 new lows in my universe of 4,000 stocks.  Friday was the first day since December 26 that there have been more new highs than lows (then, 166/40).  Friday was also the 21st day of the current QQQQ short term down-trend (D-21).  The Worden T2108 indicator is now at 53%, up from 18% at its low on Januray 18.  I have added a new indicator to the table, the % of stocks where the MACD is above their signal lines.  A move of the MACD above the signal line often foretells the beginning of an up-trend.  On Friday, 71% of the Nasdaq 100 stocks were above their signal lines, up from just 10% on January 9.  The GMI-S is now at 50%, indicating that one half of the 16 short term indicators for four index ETF’s (SPY, DIA, IJR, QQQQ) are positive.

So, what does this mean to me?  The market appears to still be in a  down-trend even as stocks rebound from the lows on January 22nd and 23rd.  The key is to remain in cash and to see whether the indexes can break above critical moving averages and hold.  If they convincingly bounce down off of resistance, it will be time to add some shorts.