The GMI is still at zero. 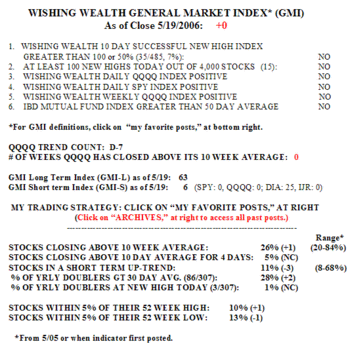 Only 11% of stocks are in a short term up trend. There were 15 new yearly highs and 105 new lows in my universe of 4,000 stocks. Only 7% of the 485 stocks that hit a new high ten days ago closed higher on Friday than they closed ten days earlier. In contrast, 10 of the 12 stocks that hit a new low ten days ago closed lower. Shorting stocks at new lows has been profitable lately. Stocks did rebound on Friday with 60-72% of the stocks in the Nasdaq 100, S&P 500 and Dow 30 indexes advancing. Friday was the seventh day (D-7) in the current QQQQ short term down trend…….
Last Monday I built a watchlist of the 100 IBD-100 stocks as of 5/16. Some people I know select all of their buys from the IBD-100 list. This past week, only 14% of the IBD-100 stocks rose. The median rise was +4.85%. On the other hand, the median decline among the 85% of the stocks that declined was -7.2%, with 27 stocks falling between 10-19.7%. In contrast, 18% of the Nasdaq 100 stocks advanced last week along with 22% of the S&P 500 stocks. The point is that the IBD 100 growth stocks performed worse than the Nasdaq 100 and S&P 500 stocks last week. This is a prime reason why IBD staff and others say that one should be in cash when the market indexes turn negative. Growth stocks cannot fight the market trend…..
I had an epiphany regarding discount brokers recently. For many years I had my account at Brown and Co. When it was taken over recently by E-trade I transferred my accounts to Fidelity. Only then did I realize how costly being at Brown had been. While Brown had cheap commissions, they paid very little interest on my cash balances. This is important because I go to cash in bad markets. Fidelity, on the other hand, automatically places my cash in their Cash Reserves money market fund. Right now I receive about 4.62% on my cash at Fidelity. Even though I trade a lot, the lower commissions would not offset the minimal interest paid by some firms. So, if you are using a discount broker, find out how much interest they pay on cash balances. You have to dig a little to find out. You too may be surprised……
I promised that I would talk about submarine stocks this weekend. Submarines are the opposite of rocket stocks. They are stocks that appear to be in confirmed down trends and likely to continue to sink. Much of my strategy was developed after reading Weinstein’s book and O’Neil’s book on shorting and studying the excellent charts both provide. I use TC2005 to scan the market for submarine stocks. As of Friday, there were 140 submarines and only 8 rockets, a good reflection of the current weak market. I scan my 4,000 stock universe for optionable stocks that have closed below their 10 week average for 7 consecutive weeks and where the 10 week average is below its 30 week average. This provides a list of stocks that I can visually review for a bearish pattern. I like to find stocks that have peaked at least 4 months ago and where the peak was far above its prior yearly low. I am looking for bull market leaders that have already topped out. I look primarily at weekly charts and want to find as least one (preferably more) week since the peak during which the stock has declined on atypically large volume. Finally, to time the short, I want the stock to have bounced down off of its 10 week average in the past few days. If the GMI index looks weak, I purchase deep in the money puts that have 6-9 months to go and that have minimal time premium. I close out the position if the stock trades above its declining 10 week average. I trade puts because one cannot sell stocks short in an IRA account, because shorting requires a margin account. However, not all discount brokers allow the purchase of puts in IRA accounts (Fidelity does). Here are two examples of submarines I have identified and shorted.
I thought that housing stocks should top out as interest rates rose. When I ran my scan for submarines, a lot of housing stocks came up. I therefore was confident in an industry-wide down trend. CTX was a perfect short for me. 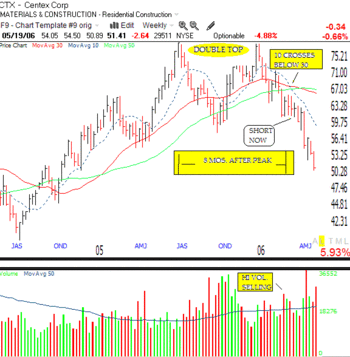 The stock made a top in July and declined on heavy volume. It then made another attempt to go to a new high, but the volume petered out in early January and the stock started to decline. This looked like a double top to me. The important 30 week average (red line, see Weinstein’s book to right on stage analysis) started to decline as the 10 week average (dotted line) began a decline and crossed the 30 week in March, 8 months after the peak. At about the time of the cross there was a week with a large volume decline, indicating the big guys were unloading the stock. The failure of CTX to rise above its declining 10 week average provided a sell short signal for me and I bought deep in the money January 80 puts to give me enough time for the decline to mature. Subsequent weekly declines on volume far above its 50 week average (blue line) gave me confidence to continue buying puts as the stock fell.
The major elements of this successful trade were: 1) a declining stock in an industry that should weaken at this stage in the economy; 2) a stock that had risen strongly and then peaked over a sufficient time period (8 mos) to exhaust the bargain hunters and short sellers; 3) high volume declines as the stock peaked; 4) 30 week moving average reversing down; 5) a cross of the 10 week below the 30 week and a failure to rise above the declining 10 week.
Now, take a look at CCL and see how many of these characteristics you can find in this stock which I successfully shorted before last week’s decline. 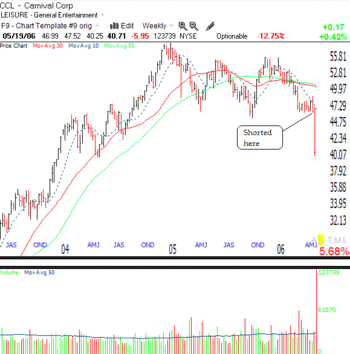 For my last assignment, take a look at the following stocks that came up this weekend in my submarine scan. See how many of these you think are good short candidates: LOGI, APOL, KOSP, OCR, SFY, MLS, CMX, IVGN, OSG, COO. Given the recent large market declines, this may not be the best time to take on new short positions. But if a subsequent rally fizzles, this is how I will locate new shorts. Let me know if this analysis was useful to you and send me any questions you may have…….
Please send your comments to: silentknight@wishingwealthblog.com.
 Only 29%of the Nasdaq 100 and S&P 500 stocks advanced on Tuesday along with 40% of the Dow 30 stocks. Only 7% of the 4,000 stocks in my universe are in a short term up trend, the lowest since I started keeping records a year ago. Only 21% of stocks closed above their longer term 10 week averages, the lowest since last October. There were 25 new highs and 88 new lows. Tuesday was the ninth day (D-9) in the current QQQQ short term down trend. In spite of this confirmed down trend it is noteworthy that the media pundits continue to look for stocks for the public to buy. You would think they would have learned something from the last bear market. This is the time to be in cash or short until the market confirms a change in trend.
 There are many high volume down weeks as the 30 week average curves down and the 10 week average (dotted line) breaks below the 30 week (red line). The stock peaked about seven months ago and the back and forth movement seems to be over as the stock failed to regain the 10 week average. This stock may be starting a long Stage 4 decline, a la Weinstein (see book to right). BMHC has many of the characteristics O’Neil mentions for a good short sale.


