Blog post: Day 43 of $QQQ short term up-trend, $POOL is the only stock to come up on my oversold bounce scan of 644 growth stocks

GMI6/6
GMI-25/9
T210832%

When the markets decline, it is easier to see potential leaders. Let’s see if the strength in POOL continues. Note the many black dot signals and its recent bounce off of the lower 2.15 daily Bollinger band, shown by green bars. I explained these signals during my recent webinar archived on the TraderLion site.

Blog post: Day 42 of $QQQ short term up-trend; Fed meets today and beware raising debt limit antics to come; treasury bonds peaked?

GMI6/6
GMI-27/9
T210834%

In my experience, the end of the month is strong, followed by weakness in the beginning of the next month. Put this together with the end of the debt limit agreement  that could lead to a government shut-down, and we have a prescription for volatility. Treasury bonds (TLT) may have peaked.


Blog post: The power of the GLB: $XPEL, $MSFT, $AAPL, $AMZN, $NET, $COST, $QQQ……..

GMI6/6
GMI-27/9
T210833%

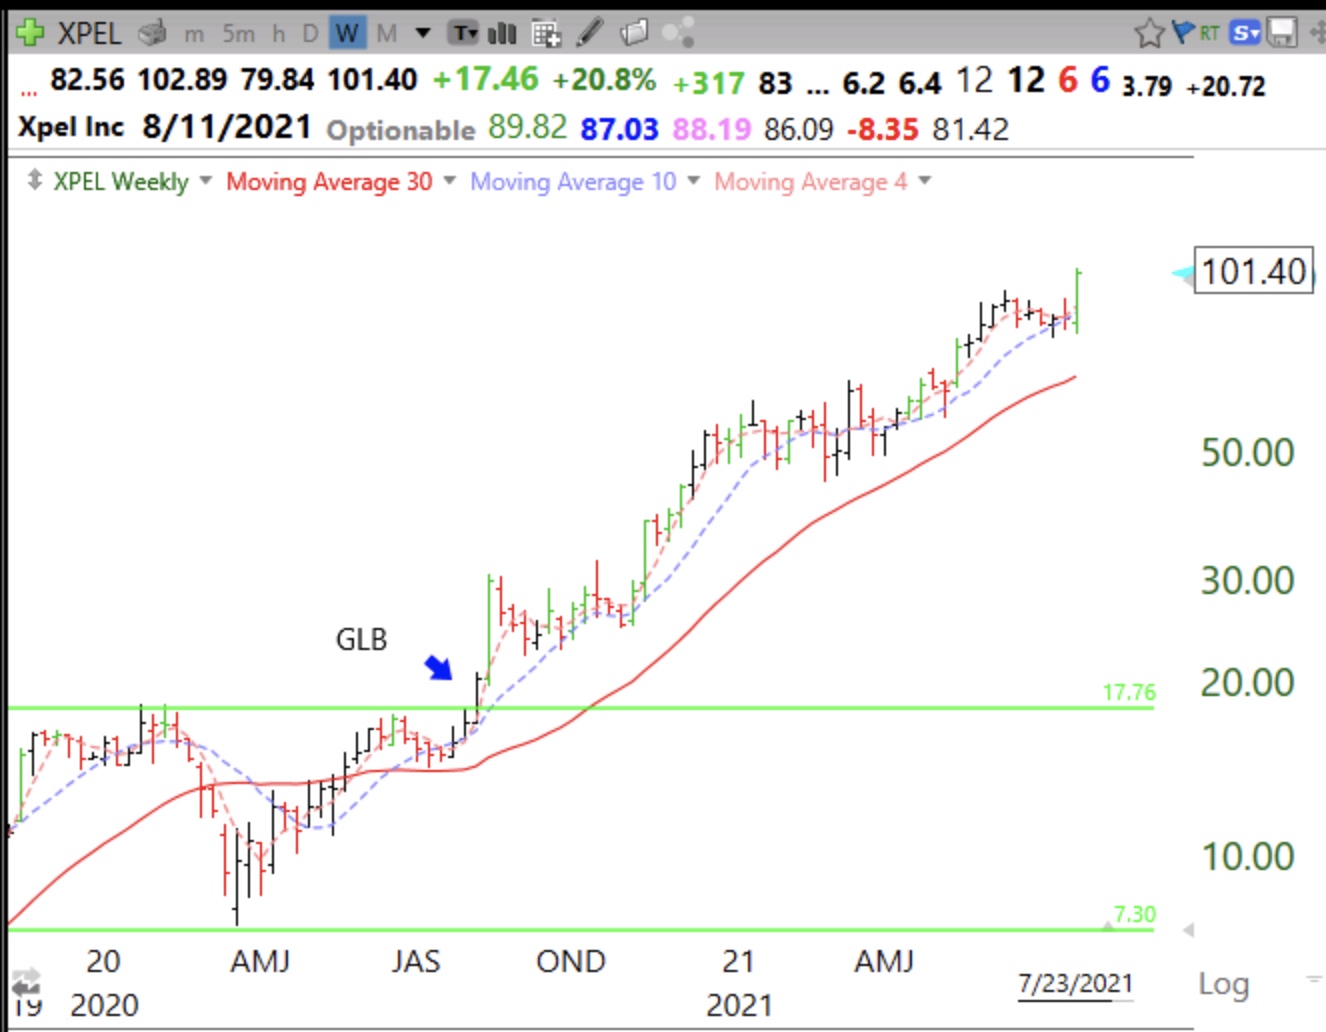
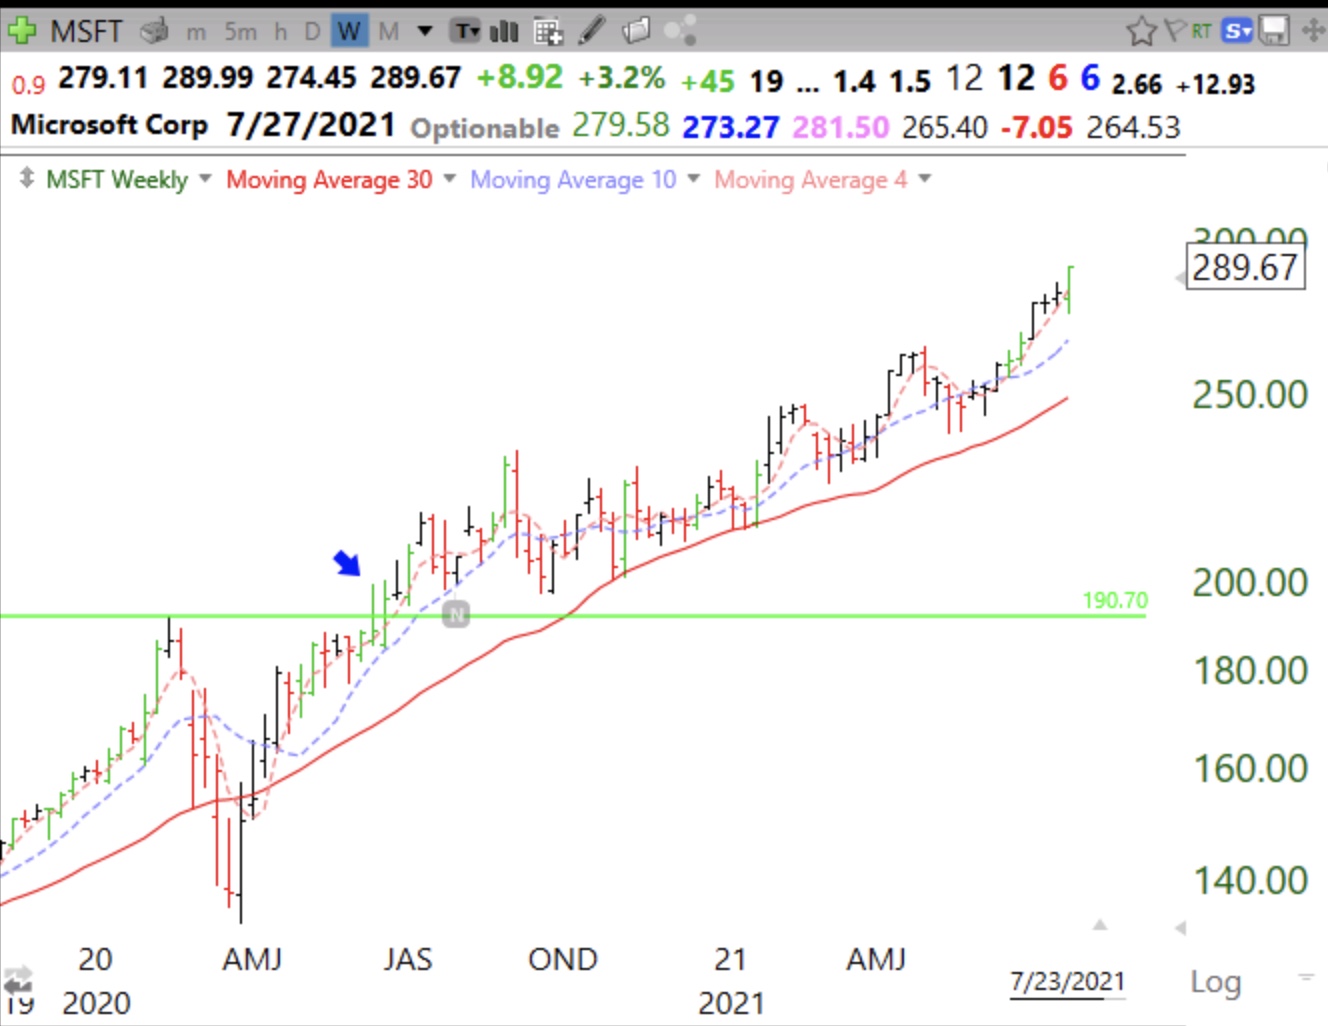
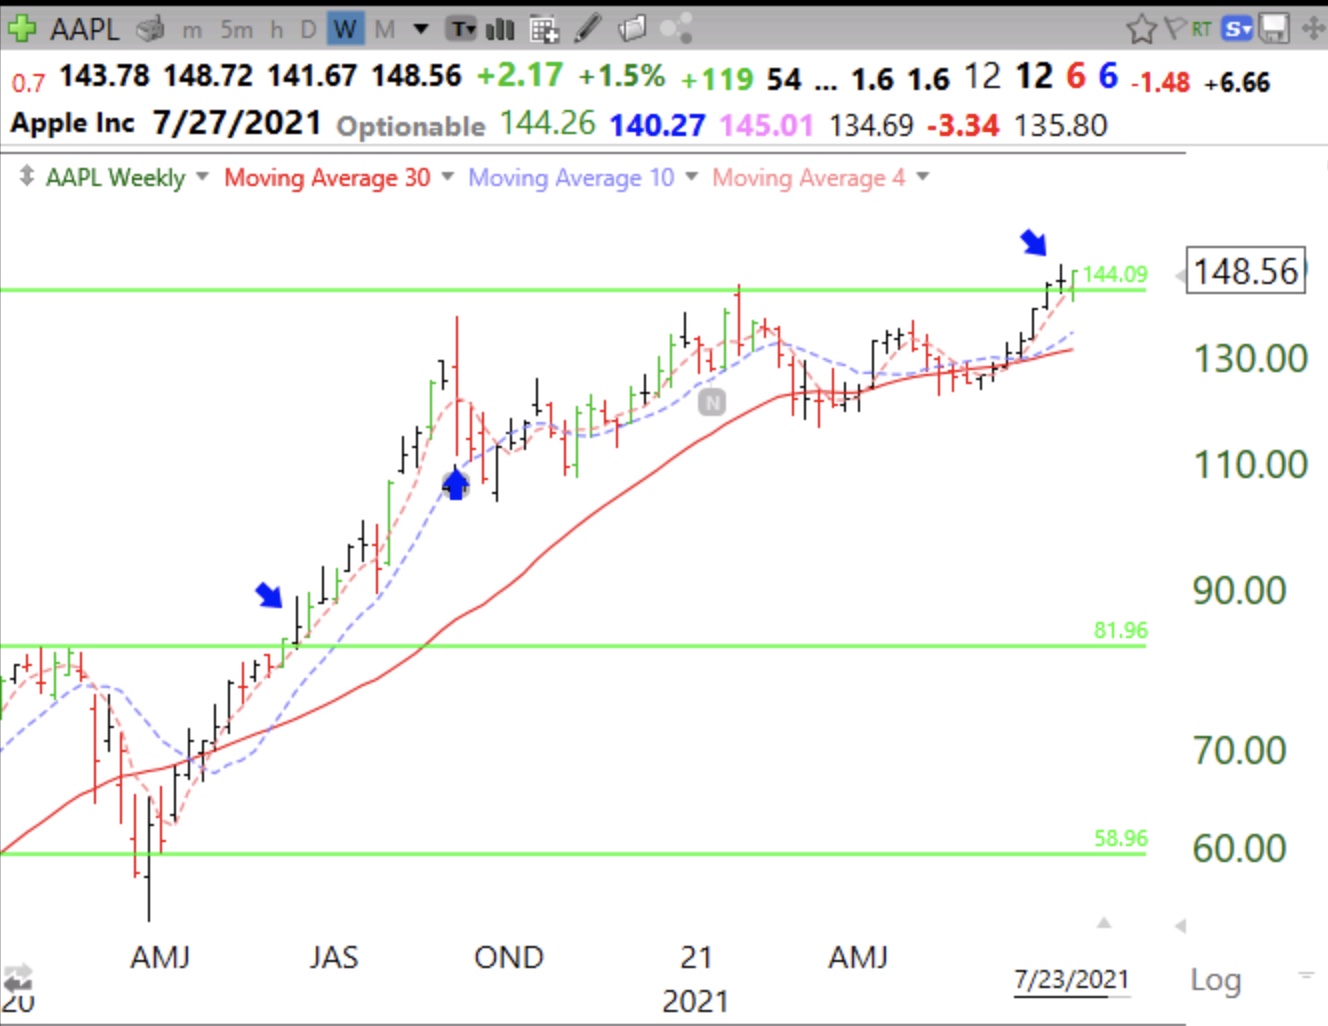
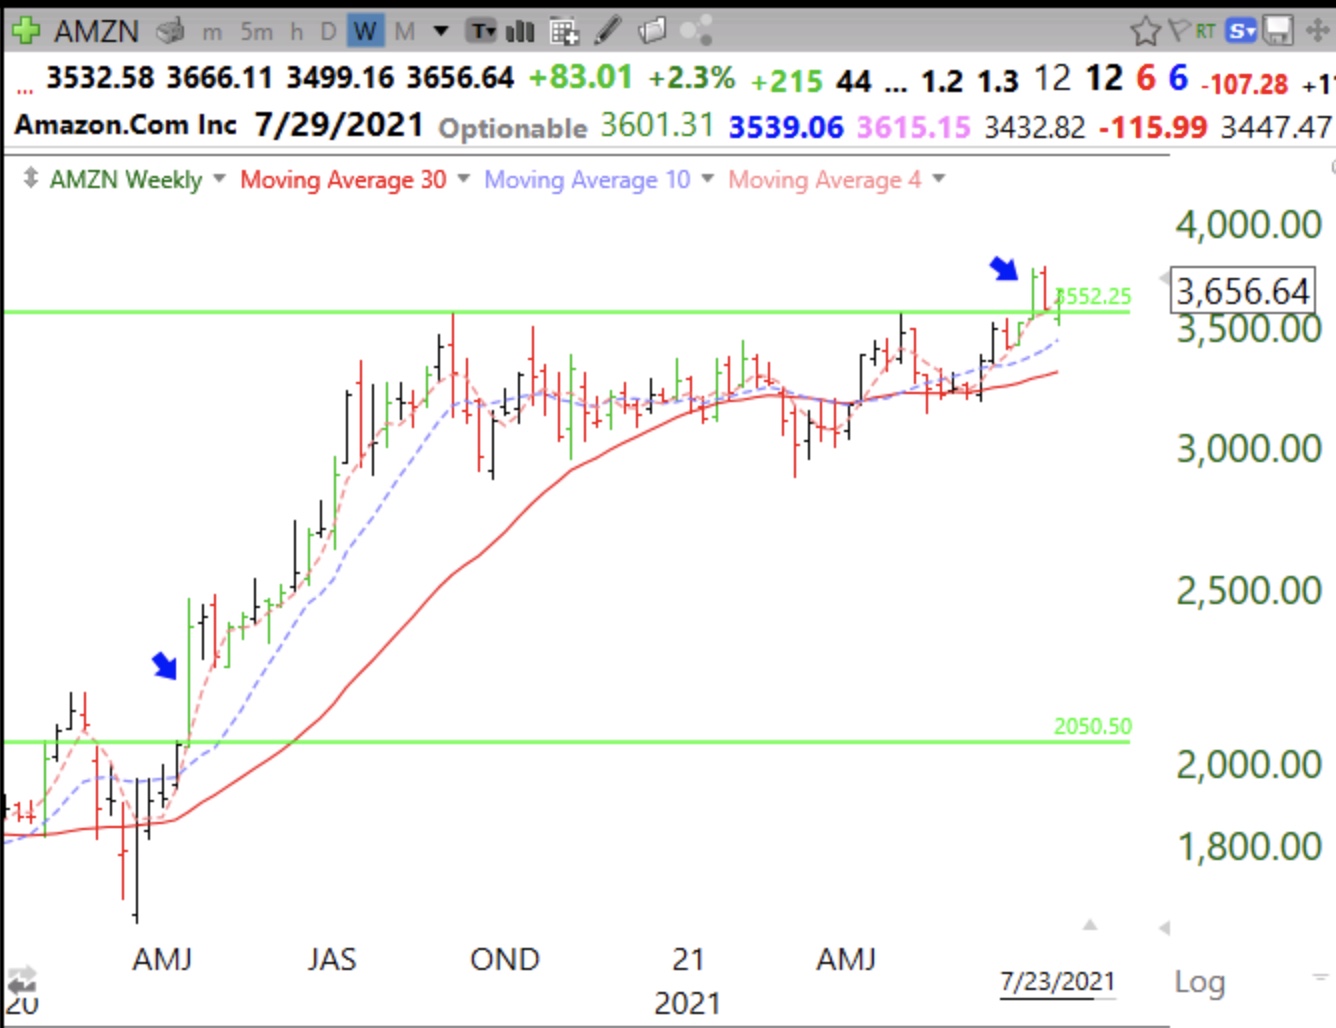
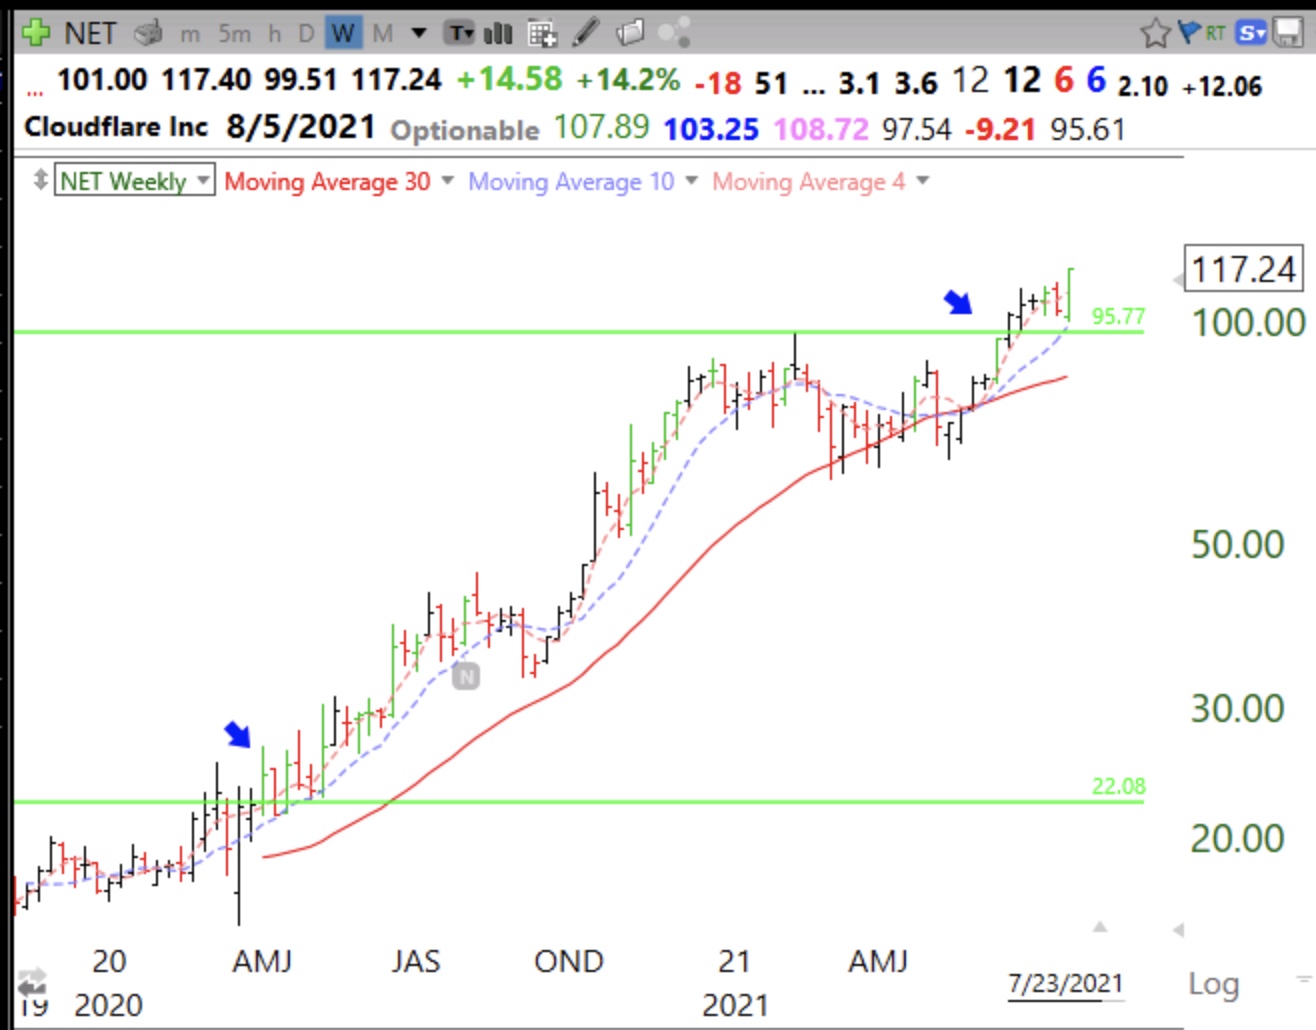
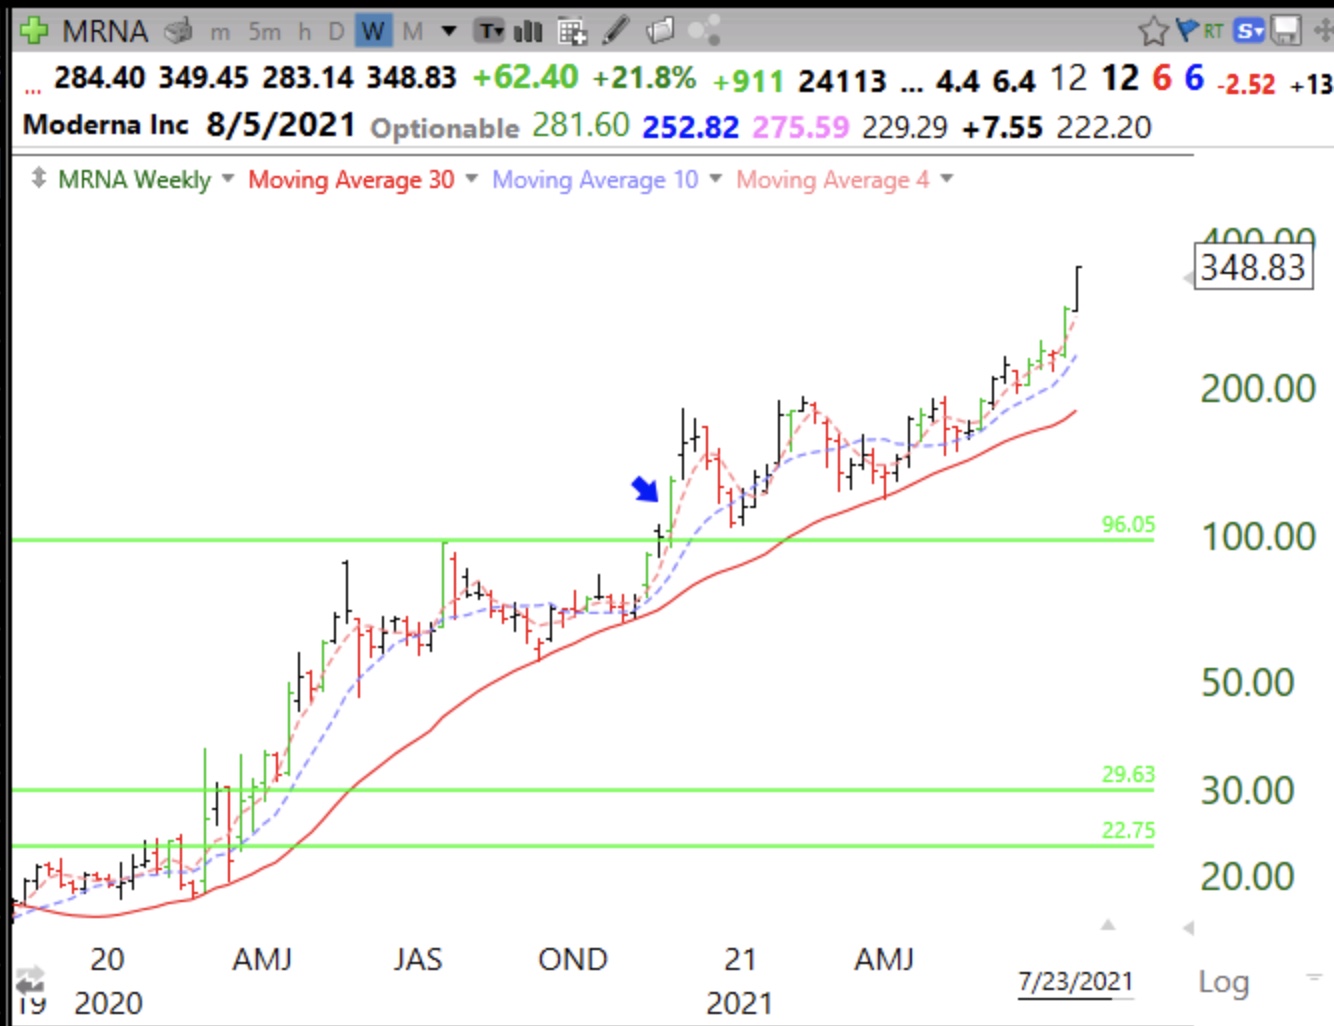
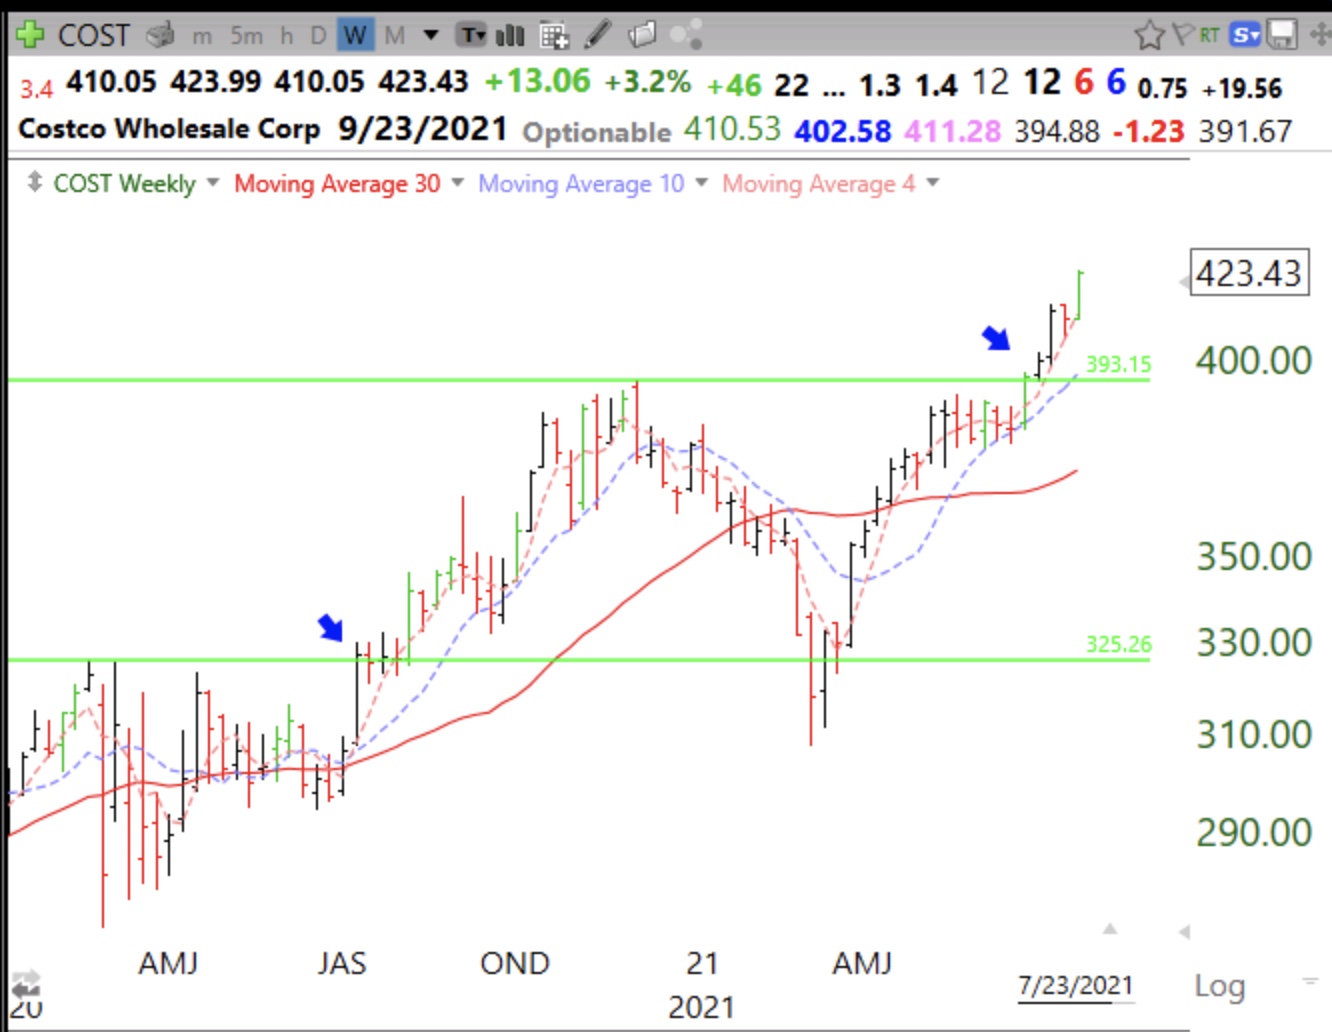
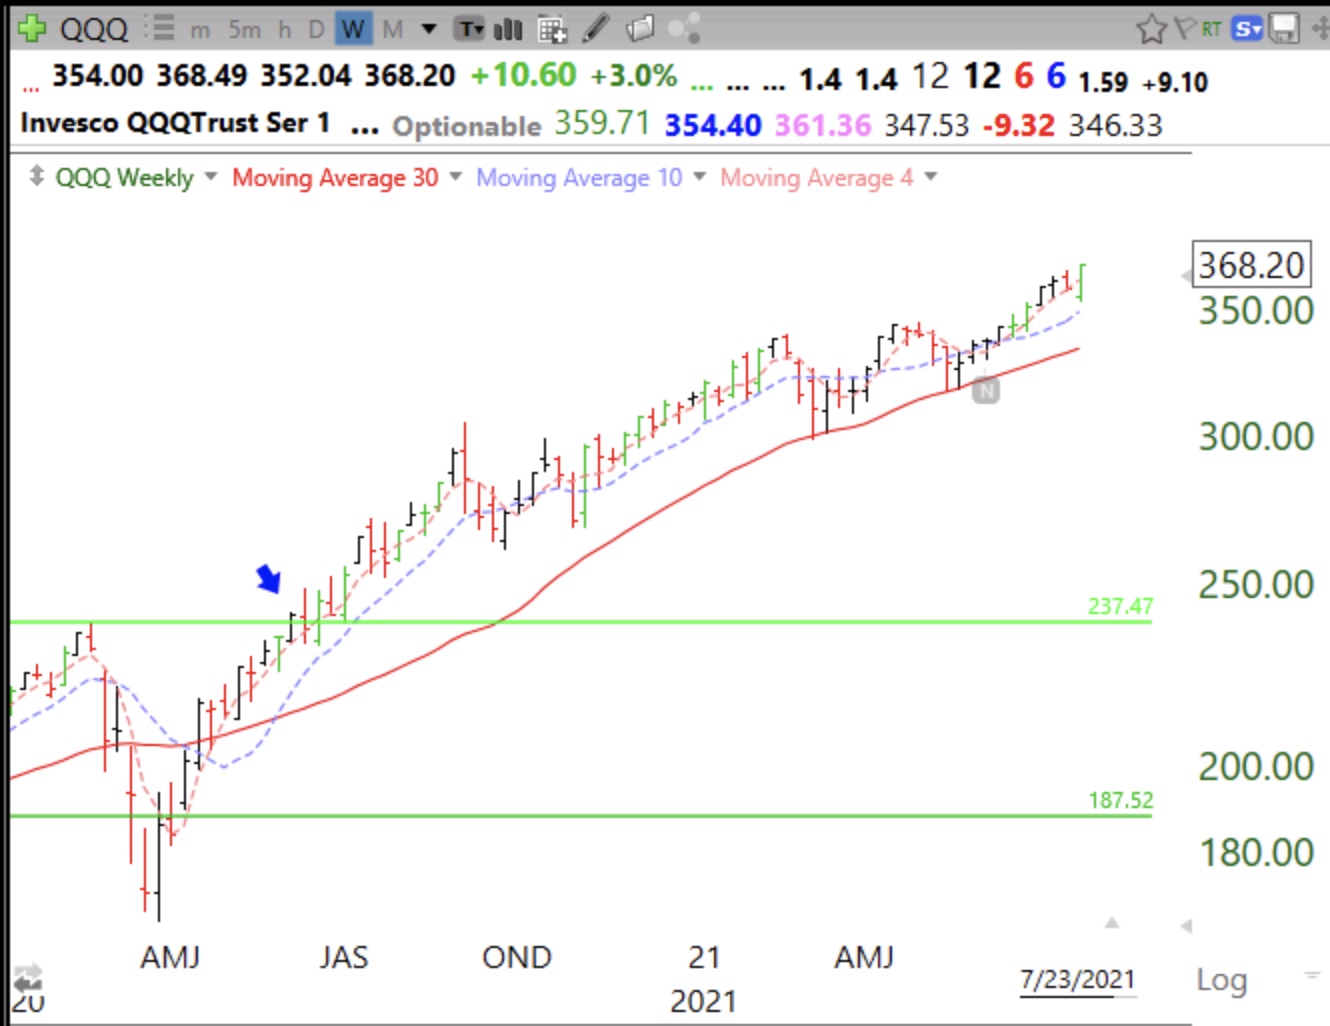
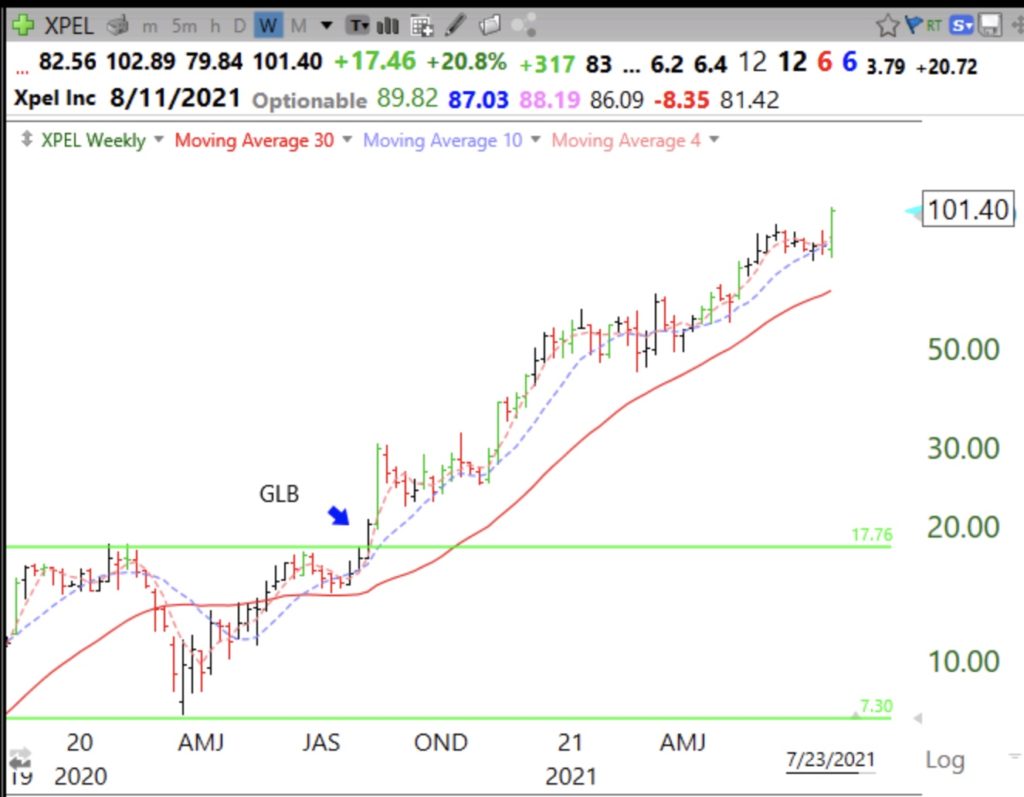
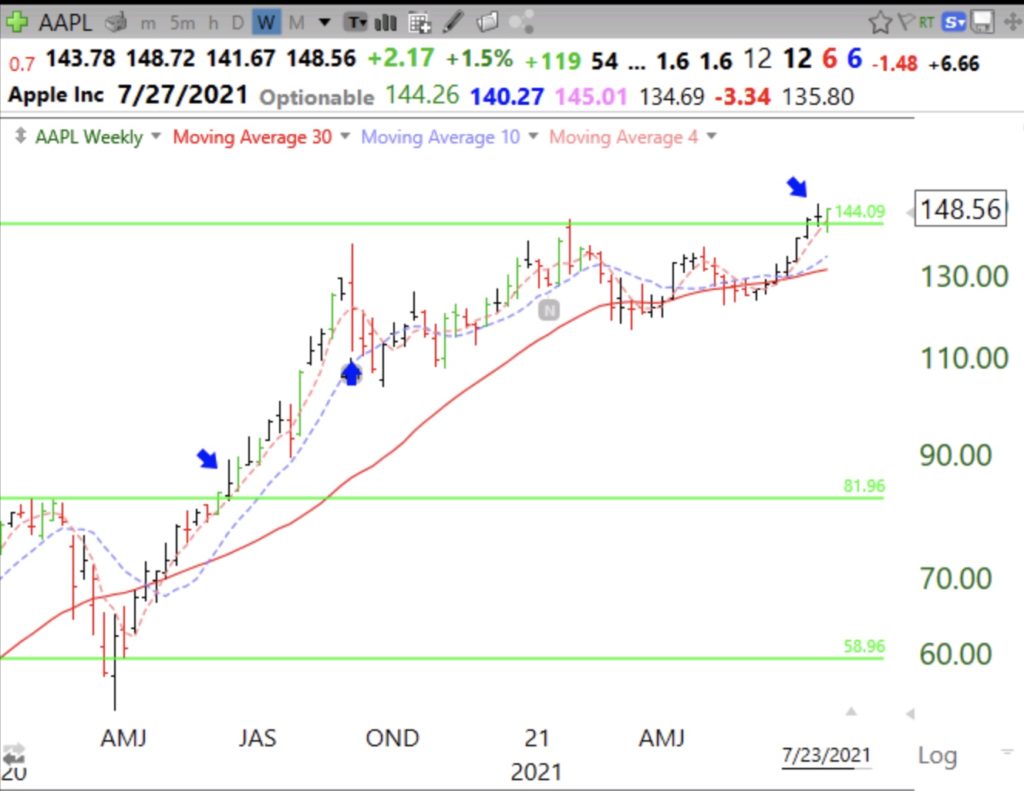
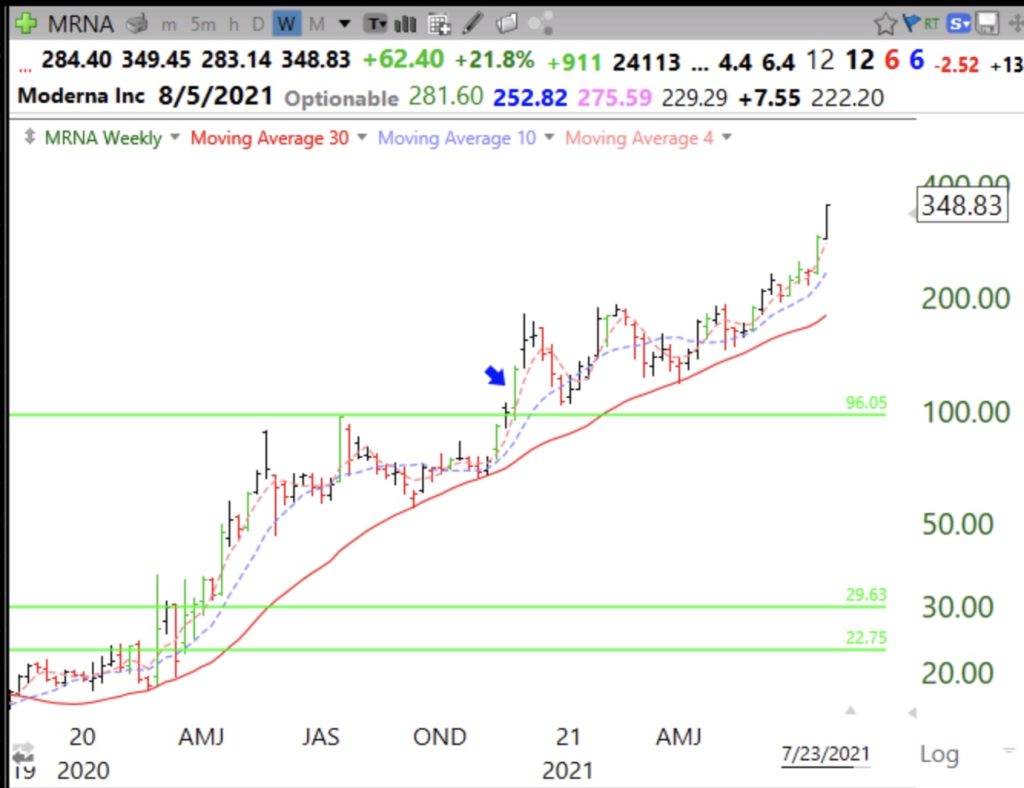
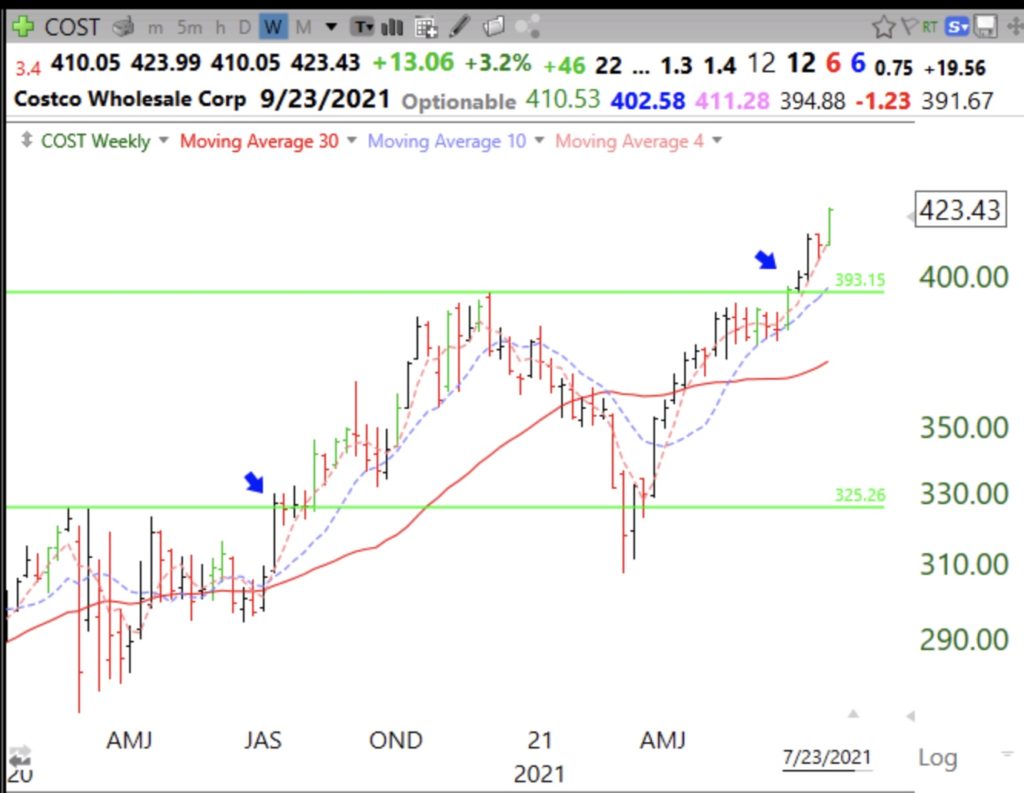
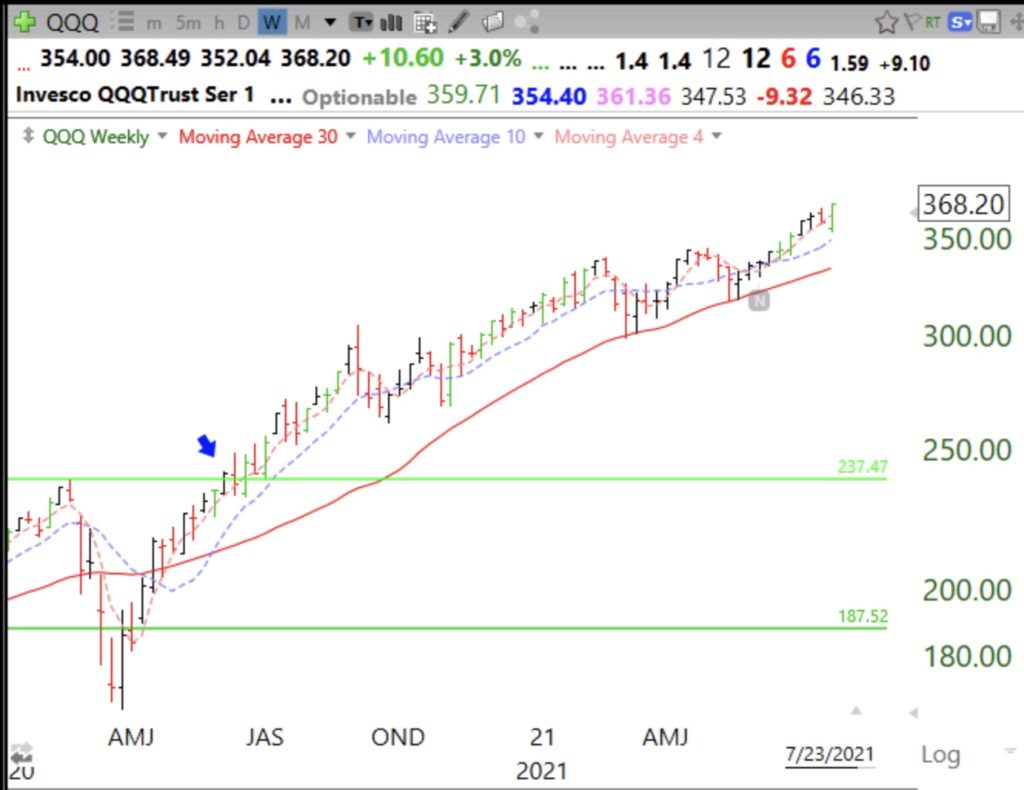
Most people are afraid to buy stocks breaking out to an all-time high (ATH) but still say they want to jump on a rocket stock heading towards the moon! Go figure. Buying a GLB (green line break-out) can lead to huge gains. I draw a green line on a monthly chart at the ATH bar after it is not surpassed for at least 3 months. The concept is to buy a strong stock that has rested and then breaks out again. Not all GLBs work. I sell immediately if the stock closes back below the green line and buy it back if it retakes it. Here are some examples, all weekly charts. You may have heard of some of these and there are many more…….

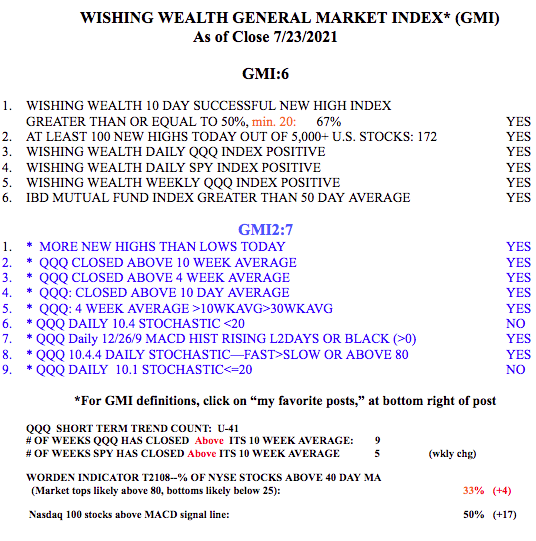
The GMI is at 6 (of 6). All components are positive. Be careful with a Fed meeting this week and the possibility of a delay in raising the U.S. debt limit.