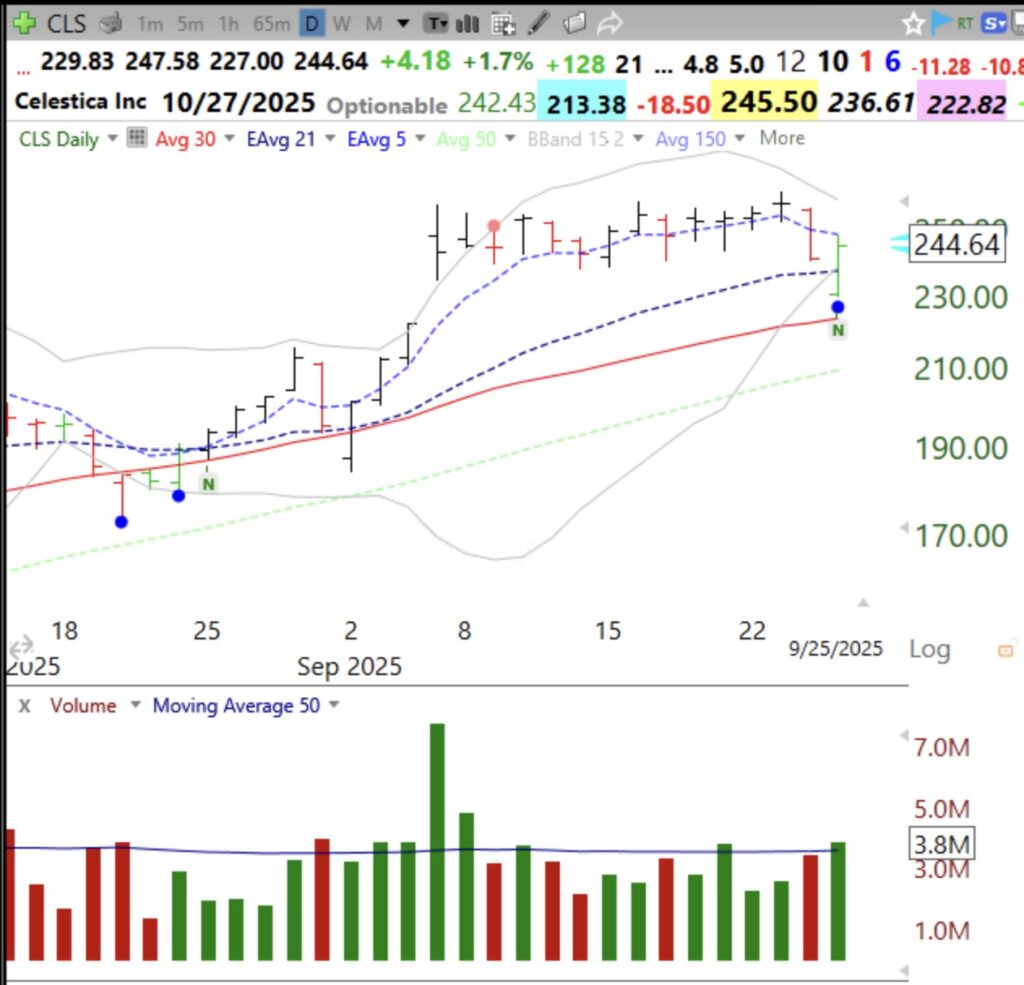
With a government shutdown possible, the market is acting weak. I sold out of most positions today but could not resist a nibble at CLS, which had a blue dot on Thursday. I know most setups are likely to fail in a weak market, but I like the way CLS behaved today and how the recent blue dot signals have worked. If it fails, my stop will get me out around today’s low. A blue dot occurs in a stock that recently reached an ATH and became very oversold. I like the fact that CLS also bounced up from its lower 15.2 daily Bollinger Band. I especially look for blue dot stocks that have also had a recent high volume rise, as did CLS. CLS rose Thursday on a weak day, showing relative strength. Its IBD RS=Comp=99 and its price is 5x its price a year ago. I am not a blind empiricist. As with CAN SLIM, stocks I purchase must look good from a technical and fundamental perspective. Let’s see if CLS holds on Friday. If you want to understand more about my Blue Dot of Happiness setup, see my recent presentation at the TraderLion 2025 Conference on Day 6. There is a webinars tab at the top of this blog too.