58th day of $QQQ short term up-trend; Since day 1, QQQ up +13.6% and $TQQQ up +43.1%

GMI6/6
GMI-27/9
T210858%

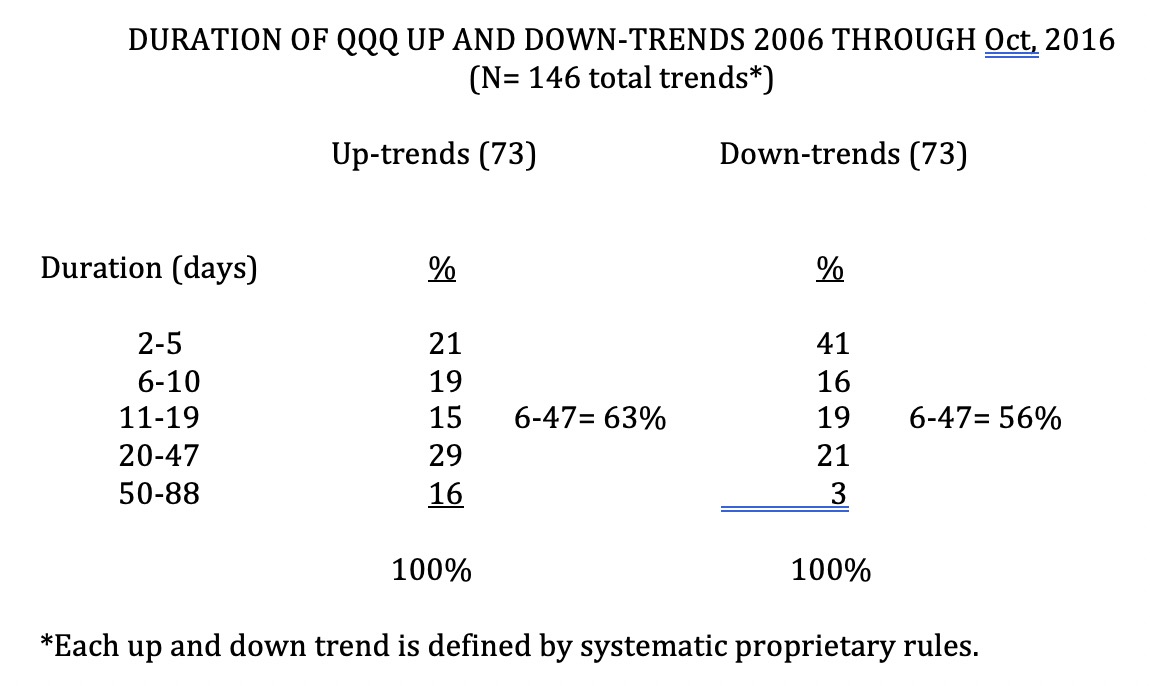
Since January 9, the first day I initiated a QQQ short term up-trend count, the QQQ has advanced +13.6% while its triple leveraged ETF, TQQQ, has advanced +43.1%. Once again, I find that merely buying TQQQ when the QQQ short term trend turns up would have given me major gains and beaten most stocks. By the way, the longest QQQ short term up-trend count I have computed from 2006-2016 lasted 88 days and only 16% lasted 50 days or more.

$WWE has Green Dot signal, bounces off of support

GMI6/6
GMI-27/9
T210861%

WWE actually met two conditions for a bounce off of support. First, it found support at its lower 15.2 daily lower Bolinger Band and second, it had a green dot signal. Review my blog and glossary for definitions of these set-ups. In plain language, the stock, which is in an up-trend,  has just bounce off of support. If I buy such stocks I place my stop below the recent low  where it bounced (around 83.89 for WWE). Note the above average volume the past 3 up days when WWE found support.


The set-up of a bounce off of the 10 week average: $TEAM

GMI5/6
GMI-25/9
T210852%

A nice set-up on a weekly chart is when a stock in an up-trend (10 wk average rising above 30 week average)  bounces up off of its 10 week average. It also helps if the stock has had a recent GLB and is trading near its ATH. A good example of this set-up was TEAM last week. If I bought this set-up, I must sell with a weekly close back below the 10 week average. Note how this set-up would have played out last August-September. (10 wk avg is blue dotted line)

The GMI remains Green.