GMI signals applied to $QQQ

GMI1/6
GMI-20/9
T210823%

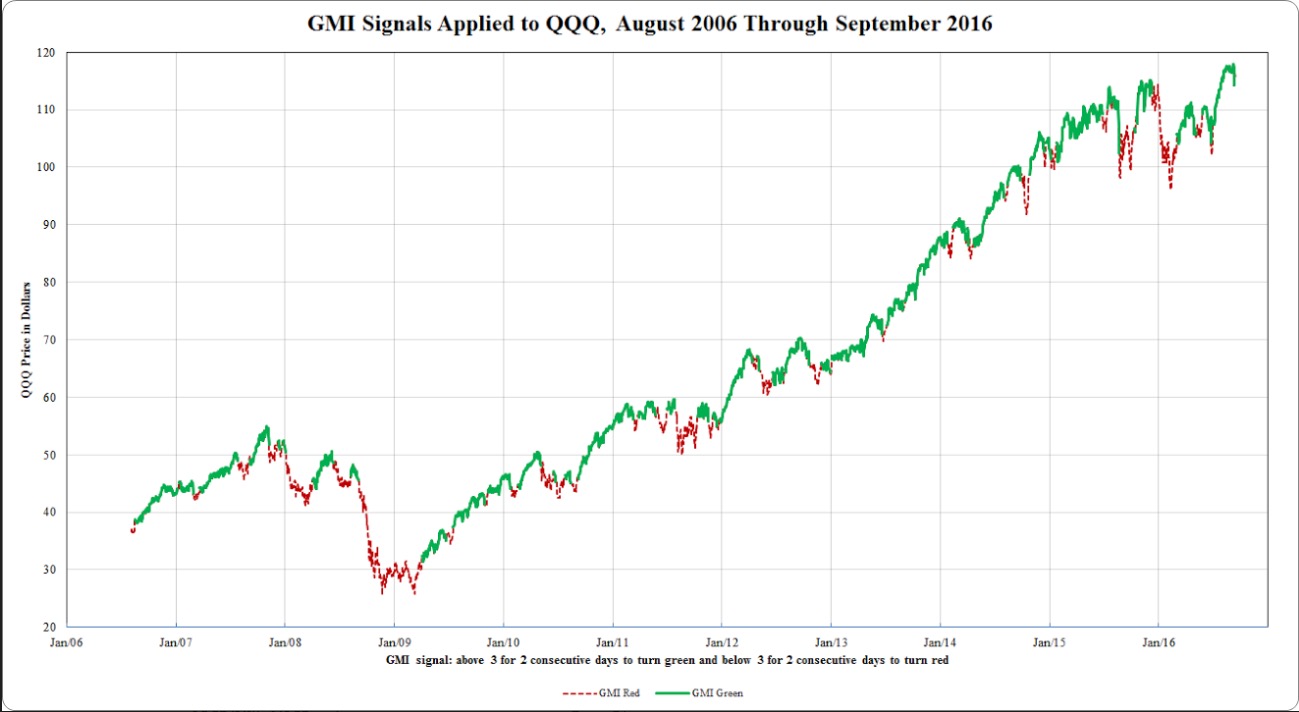
Below is a chart of the GMI signals applied to the QQQ since 2006, when I started it.  It has kept me out of the major declines and back in afterwards, although not at the exact bottom. This is a trend following tool. The GMI signals are computed differently than my short term trend count for the QQQ, currently at D-6.

screen-shot-2016-11-06-at-5-42-27-pm

Here is just the past 3 years.
screen-shot-2016-11-06-at-5-45-11-pm

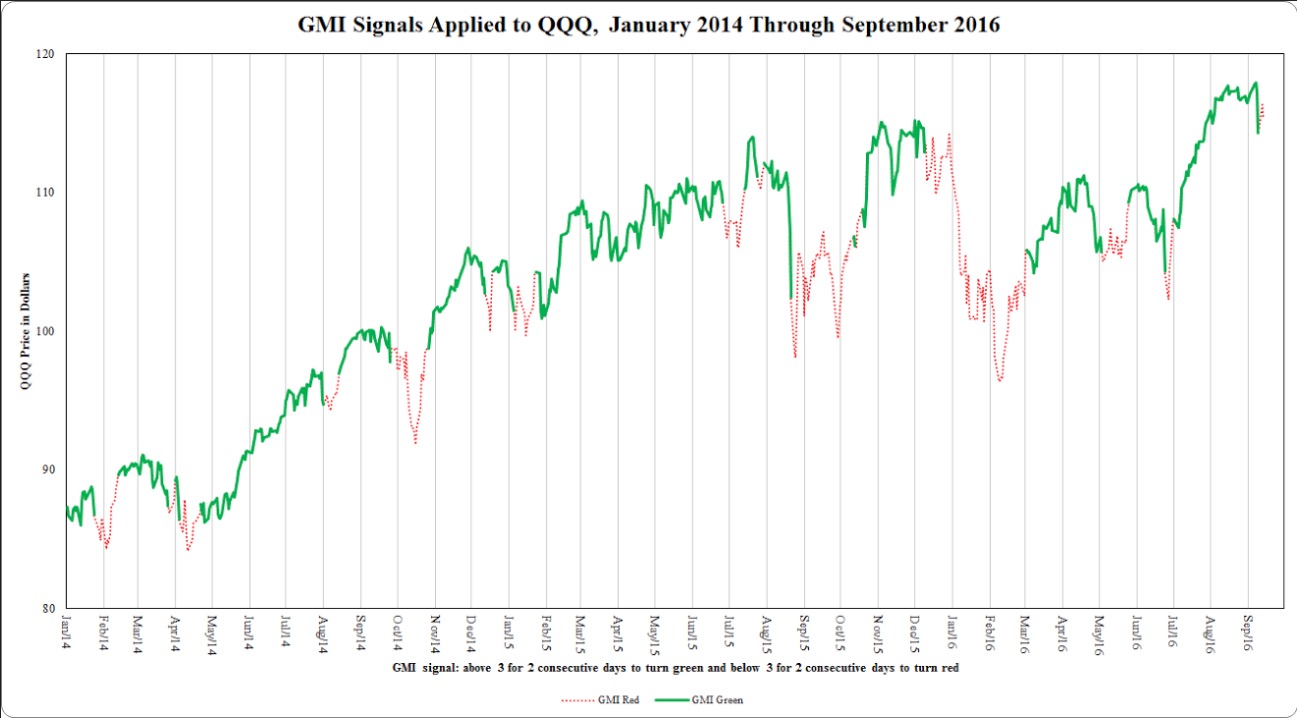
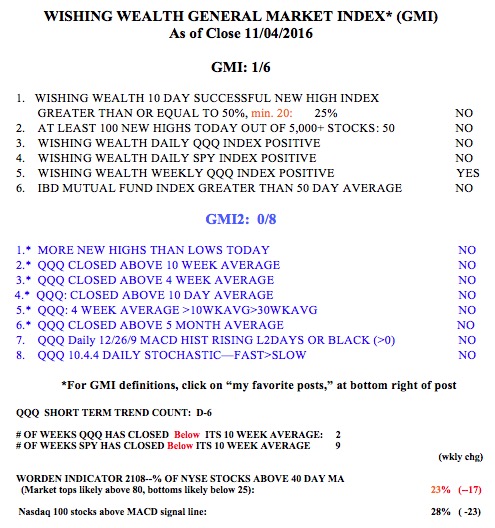
The GMI is currently 1 (of 6) and on a Red signal since October 12. I am very defensive for now.  Thank you to my co-instructor, David McCandlish, for creating the charts above.

gmi11042016


4th day of $QQQ short term down-trend; mainly in cash; but $SQ not so square!

GMI1/6
GMI-20/9
T210821%

The leaders are breaking down. The DIA and SPY have now closed below their 30 week averages.  Only 30 stocks hit a new high while 201 hit new 52 week lows on Wednesday. This is not a market to go long growth stocks near new highs. Time for me to be in cash or short in SQQQ.

However, SQ was one exception to the carnage. It released some good fundamentals and is worthy of monitoring. Note the large black up volume spikes on this daily chart.

screen-shot-2016-11-02-at-9-07-00-pm