3rd day of $QQQ short term up-trend; $FB and $ELLI show strength

GMI3/6
GMI-24/9
T210848%

With Wednesday’s one day reversal, this market is beginning to show resilience. The GMI is back to 3 (of 6). Time to look for some emerging leaders.

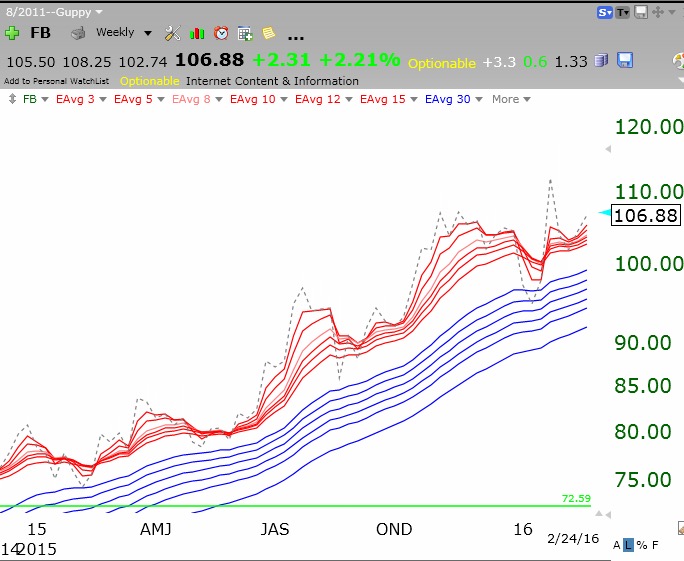
I like the way FB is behaving. It bounced on Wednesday. Also, any stock that can maintain its RWB up-trend during the past few months of market weakness merits attention. Note the stock closed Wednesday above all of its 12 moving averages. The gray dotted line shows each weekly close.

FBGMMA02242016
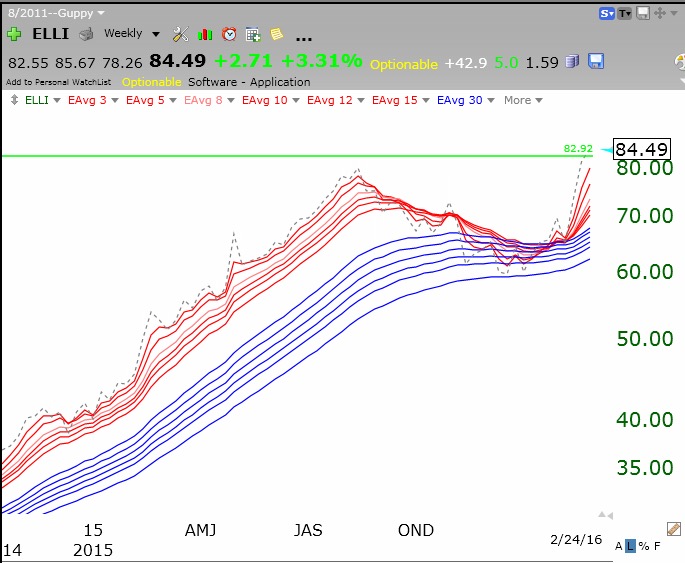
And ELLI is in the middle of a GLB to an all-time high.

ELLIweekly
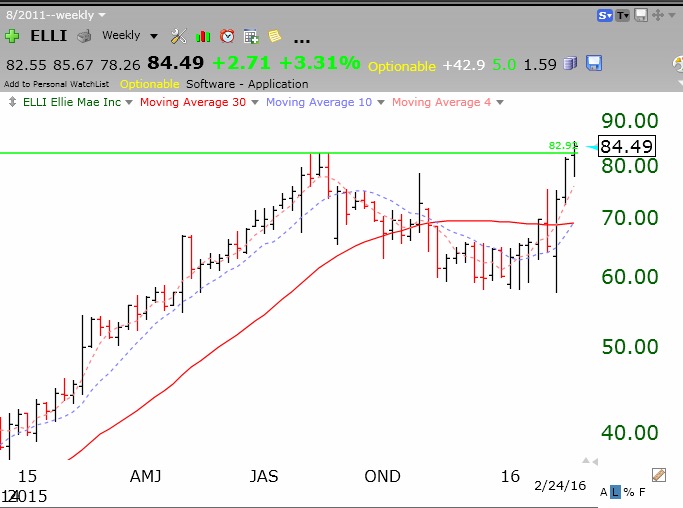
And may be showing resumption of its strong RWB up-trend.

ELLIGMMA


2nd day of new $QQQ short term up-trend

GMI2/6
GMI-24/9
T210844%

I do not trust a new QQQ short term up-trend until it lasts 5 days. The GMI remains on a Sell signal. The daily 10.4 stochastics for the QQQ and SPY are very over-bought and beginning to turn down. I remain mainly in cash. Here is the daily chart of the SPY (S&P500 ETF). Will it hold the 30 day average (red line)?

Screen Shot 2016-02-23 at 11.07.14 PM


New $QQQ short term up-trend but GMI remains on a Sell

GMI2/6
GMI-25/9
T210848%

While the longer term trend for the QQQ remains down with the GMI on a Sell signal, the short term trend has just turned up, after completing 33 days of a short term down-trend. The QQQ is rebounding from the January decline and it remains to be seen whether this rebound will fail and the down-trend resume. This weekly chart of the QQQ clearly shows the rebound is in its third week. I think the QQQ has severe resistance around the 105 level. Note the 30 week average (red line) is still declining.

QQQweekly02222016

The QQQ daily stochastic is overbought at 90, and the QQQ is approaching its upper daily 15.2 Bollinger Band, around 105.40. This rally may only have a few days or % more to go. And the SPY remains in an ominous BWR down-trend.

QQQGMMA02222016

Time will tell if the bottom is in or if we go down again….