Darvas’ stock market casino, fabricated fantasy, interest rates resume rise, a new trend count; GMI: +5

"It means, as I see it, that the corporation gets the money it needs, absolutely free and clear of any obligation to repay it–ever.  The underwriters get their cut or commission (or both) for placing the stock issue.  The stockbrokers who handle all subsequent transactions in the stock get their commission.  And the public will get "shares" (i.e., chips) with which to gamble–the gamble being, of course, that someone else will pay you a profit on them in the hope of selling them to a third person for a little bit more , and so on in an endless cycle of speculation.  This is, in essence, the entire story of the stock market, as I have found it."

Nicolas Darvas, Wall Street: The Other Las Vegas, Kensington Publishing, 1964, p. 54-55.

I read Darvas’ books in the 1960’s and they had and continue to have a profound impact on my approach to the market.  I know that William O’Neil and some of his colleagues have also referred to Darvas’ influence on their trading strategies.  Here is a man, Darvas, who made almost 2 million dollars in the stock market in 18 months while he danced around the world, subsequently saying that the stock market was just a venue for gambling.

After the internet bubble and the tech stocks collapsed so badly in 2000-02, I think many of the people who were so badly burned, would agree with Darvas.  Nevertheless, there persists an entire industry of people who attempt to make the market seem rational and spend lots of time analyzing the "true value" of stocks.  What if Darvas is right?  All of these people and institutions who are paid millions of dollars for their financial advice are simply involved in a world of fabricated fantasy.  If Darvas is right, the idea of having people trusting their economic futures (and social security) to the whims of the great stock market casino terrifies me. As Darvas says at the end his book, "I walk into the Casino with my eyes open as I would if I were walking into a Casino in Las Vegas.  I ignore the chatter, I watch the action; and, I try my luck."  I believe that this is our mission as market technicians. ……………………………………….

The GMI held at +5 today.  The market has weakened some, Gmi524 however, with only 132 new 52 week highs, down from 197 new highs on 5/18.  There were 28 new lows in my universe of almost 4,000 stocks.  Successful 10 day new highs were 50 today, down from 84 on 5/19.  Only 46% of the Nasdaq 100 stocks rose today, 41% of the S&P 500 stocks and 43% of the Dow 30.  Put another way, the majority of the stocks in these indexes declined or were unchanged today.  This rally may be taking a breather.  Note that the GMI is explained in my post on 4/26.
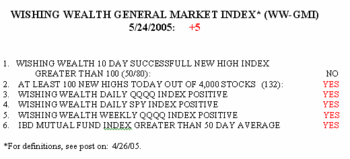
As long as the GMI stays at +5, I feel comfortable holding stocks and buying stocks that bounce off of support levels.  I am not as confident of buying new highs right now, however. Some of my stocks hit new highs today but closed near their lows of the day (GOOG, BOOM).

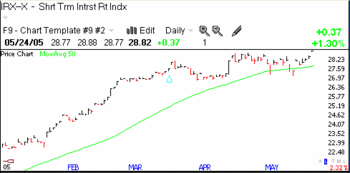
There is one big negative that I see.  The short term interestIrx524_1 rate index went to a new high today (click on figure to enlarge). Speculators are again betting on more Fed rate hikes and this could eventually torpedo the market.  If it does, the weakness will show up in the GMI.  Nevertheless, the resumption of the rise in this index just makes me a little more cautious about the possible longevity of this bull move…………………………………………….
I am introducing today another indicator I find useful.  I simply count the days since the current trend began.  Today is day 13 of the rally, as I define its inception.   I will use the term U-13 (for today’s count) to designate the duration of an uptrend. A downtrend will be indicated by D-xxx.  This indicator will help us to monitor the maturity of a trend.  At some point I will show you an analysis I did of the duration of up and down trends over the past few years.  It helps me to determine how likely it is that a trend will continue. In future posts I will include this trend count in the GMI indicator box.

Send me your feedback at silentknight@wishingwealthblog.com

Please remember that the stock market is a risky place, especially now.  I am not providing recommendations for you to follow.  My goal is to share tools and methods that I have used over the past 40 years of trading, so that you may learn from them and adapt them to your trading style and needs.  While I do my best, I do not guarantee the accuracy of any statistics computed or any resources linked to my blog.  Please consult with your financial adviser and a mental health practitioner before you enter the stock market,  and please do not take unaffordable risks in the current market environment.  See the About section for more statements designed to protect you (and me) as you navigate this market. Past performance does not guarantee future results, but I would rather learn from a former winner than a loser.
Google rockets on; Funds to time the market; BOOM-cup with handle; GMI–+5

Well, this market is really moving.  Did you see GOOG’s $13+ rise today?  Honest, I had no idea when I wrote Sunday’s post.  Cramer is shouting– BUY GOOGLE!!!  He obviously had this one right.

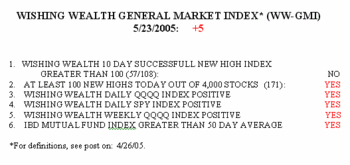
  Gmi523 The GMI is solid at +5.  This reading does not mean that we won’t have declines–only that the current trend is up.  These indicators have gotten me out of every major market decline since 98, and I will let you know when I begin to get defensive.  (Remember, past performance does not guarantee future results and blah, blah blah…)  Right now things could not look much better to me.  There were 171 new 52 week highs in my universe of 4,000 active stocks, and only 17 new lows.  Let’s say it again: there were ten times as many new highs than new lows today!  What a turn around in just a couple of weeks.  Today, 53% of the NASDAQ 100 stocks rose, 70% of the Dow 30 and 65% of the S&P 500 stocks.  These numbers are good, but not as strong as a few days ago when we saw 70% or more of the stocks in all of these indexes rising.  So, we are getting a little weakening, which is a good thing. We want a market with some backing and filling so this rise will last a while.

I moved my 401(k) funds from the money market fund to equities about a week ago.  Most mutual fund families allow a limited amount of transfers between funds.  Did you know, however, that there are at least 2 mutual fund families that are designed to allow you to time the market?  If you are good at trading the market indexes, you owe it to yourself to check out the Rydex Funds and the ProFunds.  These funds allow daily trading back and forth in a variety of index and sector funds.  In fact, you can buy funds that move with or opposite to an index, so you can profit from a decline in an index if you are bearish.  Better still, some of their funds are leveraged so that they move twice as much as the indices they  track.  So, if you have the minumum ($15,000 for ProFunds) to open an account and you want to take a bullish or bearish position on the market, these funds may be the way to go. You could also open an IRA in one of these funds.  Read the prospectus carefully and note each fund’s management fees.

I have been meaning to tell you that JNJ is looking sick.  The chart shows high volume selling last week and it only managed a small gain today.  Is the stock telling us something?

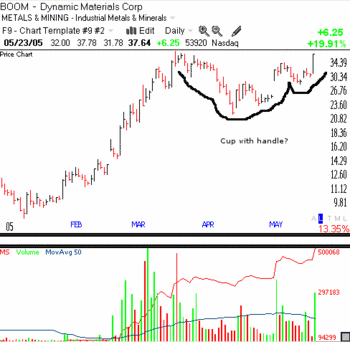
BOOM looks like a high volume breakout today–cup and handle?  (I own a few shares of BOOM).Boom The cup with handle pattern was made famous by William O’Neil and his newspaper, IBD. Note the huge rise in BOOM from under $10 to almost $39.  Then it entered a 3 month base.  It formed the top of the right side of the cup on May 10 at 35.18.  Note the huge gap up on high volume to build the right side of the cup.  Today BOOM burst through the top of the handle on volume that was far above its 50 day moving average (blue horizontal line) and closed at 37.64.  The IBD ratings for BOOM are:  Overall–94; RS-99, EPS-89.  Thus, according to the IBD criteria this company ranks in the top 4% of all stocks, with a relative (technical) strength rating in the top 1% and earnings per share rating in the top 11% of all companies.

I already own this stock.  How would I play it if I did not?  I might make a small pilot buy tomorrow and place an immediate sell stop below today’s low at around 31.75.  Alternatively, I might place a buy stop at 39 to purchase a small number of shares it if it breaks through to an all time new high. In that case I might then place a sell stop closer to the breakout point.  In a true breakout, the stock should not come back down below the prior peak.

Other strong stocks to watch include:  SNHY, CLHB, BEBE and of course, HANS.  There are so many more.

Send me your feedback at silentknight@wishingwealthblog.com

Please remember that the stock market is a risky place, especially now.  I am not providing recommendations for you to follow.  My goal is to share tools and methods that I have used over the past 40 years of trading, so that you may learn from them and adapt them to your trading style and needs.  While I do my best, I do not guarantee the accuracy of any statistics computed or any resources linked to my blog.  Please consult with your financial adviser and a mental health practitioner before you enter the stock market,  and please do not take unaffordable risks in the current market environment.  See the About section for more statements designed to protect you (and me) as you navigate this market. Past performance does not guarantee future results, but I would rather learn from a former winner than a loser.
GMI rises to +5, The Google Rocket, Lucky Bill Miller

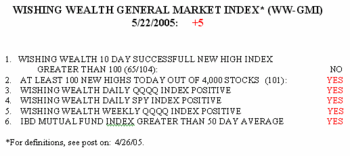
The WW-GMI moved to a +5, indicating that the markets, especially the NASDAQ stocks, are in an uptrend.  Gmi522 The only component not yet positive is the Successful New High Index.  Nevertheless, that Index shows that 65 of the 104 stocks in my universe that hit a new high 10 days ago closed higher on Friday than they did 10 days earlier when they hit their highs.  Thus, a trader buying new highs 1o days ago had about a 65% chance of owning a stock that increased on the subsequent 10 days.  In contrast, only about one third (15/44) of the stocks that hit new lows 10 days ago were trading lower on Friday. (Even the majority of the new lows 10 days ago rose!) The market is telling us that buying new highs has been a better strategy than shorting new lows.

Remember a few days ago I said that my gut was telling me the market should go down but my instruments were telling me to buy.  One must always go with his/her instruments–the market action.  I do not waste a lot of time trying to divine the market’s direction by focusing on economic news or current events. Don’t get attached to a scenario.  Just watch the market and tune out all of the rest.

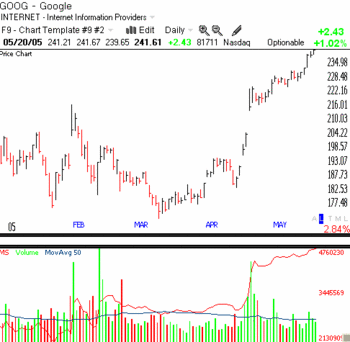
So, I am content to own stocks now and to stay with this rising trend.  That does not mean that I will plunge into the market.  Instead, I look for the stocks that are moving to new highs on good volume and I take a small initial position.  If I am right and the stock moves up, I make more small purchases, each one higher than the other. I do not want bargains.  Goog2 The same is true of real estate.  The beach front property that looked too expensive a few years ago today is much more expensive.    Thus, I began buying GOOG at around 221 after it gapped up, and have slowly added more each time it broke to a new high, after it had rested for a few days.  I have kept my sell stops in place and raised them as the stock rises and each time I make a new purchase.

Is GOOG too expensive?  I do not know.  One never knows the answer to such questions until after the fact.  I guess you could say that GOOG was too cheap at 221.  Since GOOG gapped up on 4/22 there have been 20 trading days, 15 up days and 5 down days,  so people are bidding the shares up 3 times more often than down.  So, I just ride the rocket up, knowing that my sell stops will get me out if the stock falters–I have limited my emotion and limited any pontificating about the stock’s likely future.

In a rising market, 70% of the stocks rise, and I am content to hold on with the odds in my favor. How many stocks have come through this year’s sloppy market and are trading at their all time highs? Isn’t that the type of strength we should be seeking in our purchases?  I suspect that many of the rockets to the moon have already been launched………………………………

I had hoped to write about some technical strategy matters this weekend but could not get to it. In the near future I want to cover  moving averages, my tragedy (911) watch list, and  stop orders.  Let me know whether you are interested in any of  these, or other, topics…………………………………….

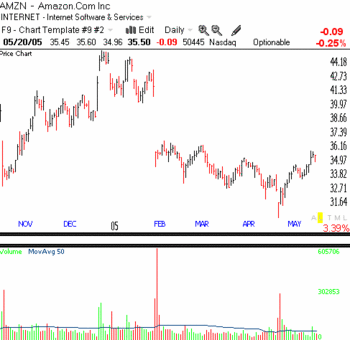
As you may know, Bill Miller’s Value Trust Fund  receives a lot of accolades for beating the S&P 500 index for 14 consecutive years. I have a somewhat different opinion of the fund’s most recent record than is espoused by the article that I linked to above.  I thought I would share it with you, and welcome your comments.  This fund holds a limited number of stocks (one has to, in order to beat the averages–see my post on the limitations of diversification) and I happened to be examining the fund’s top holdings a few months ago.Amzn  What caught my attention was that AMZN, one of the fund’s largest holdings, had an unusual jump in price and volume in the last few days of 2004, and then immediately tanked in 2005. Between 12/23 and 12/31, AMZN rose 13.77%, while the S&P 500 rose just 0.15%.  Another big Value Fund holding, IACI, also had a huge December rise (+11.87%), followed by a New Year’s collapse. What an extraordinary piece of luck for B.M.—and for his record, that the two stocks making up so much of the fund’s portfolio enjoyed such a surge in year end buying. I wonder, would a big mutual fund family concentrate its buying in a few stocks to preserve the reputation of its star performer?

Send me your feedback at silentknight@wishingwealthblog.com

Please remember that the stock market is a risky place, especially now.  I am not providing recommendations for you to follow.  My goal is to share tools and methods that I have used over the past 40 years of trading, so that you may learn from them and adapt them to your trading style and needs.  While I do my best, I do not guarantee the accuracy of any statistics computed or any resources linked to my blog.  Please consult with your financial adviser and a mental health practitioner before you enter the stock market,  and please do not take unaffordable risks in the current market environment.  See the About section for more statements designed to protect you (and me) as you navigate this market. Past performance does not guarantee future results, but I would rather learn from a former winner than a loser.