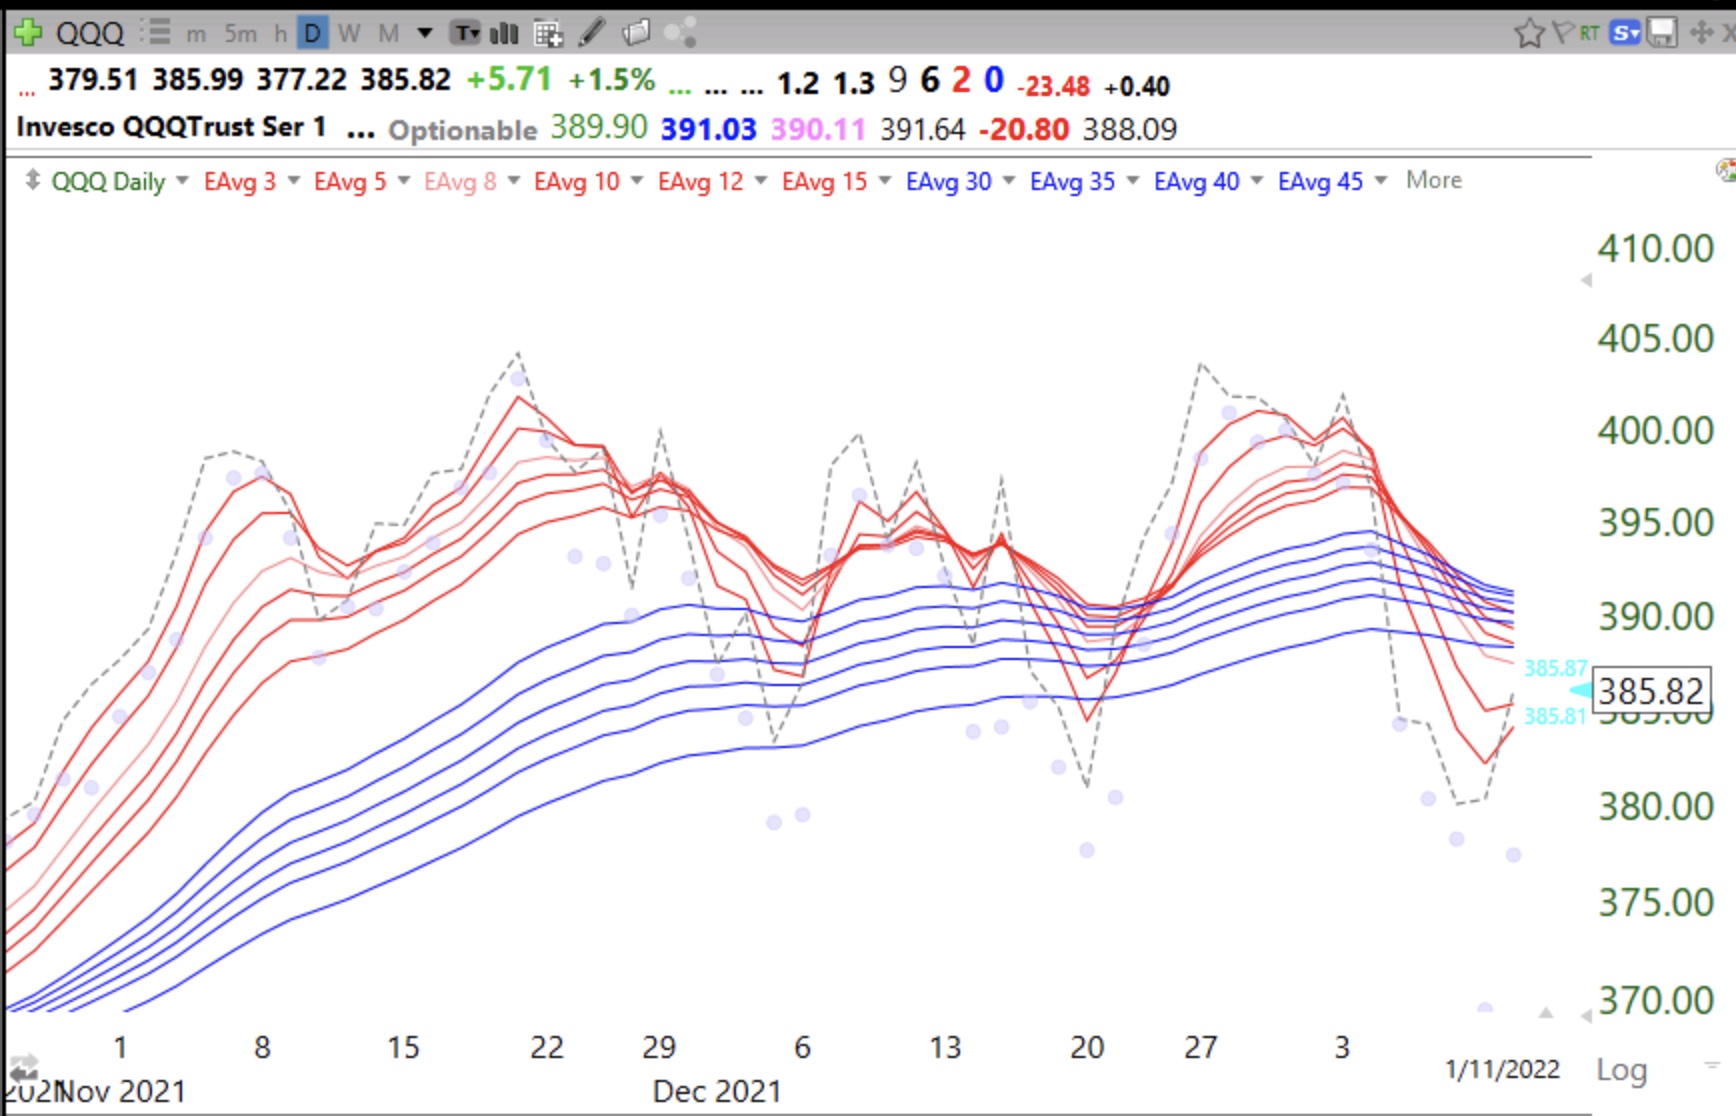
Blog post: 10th day of $QQQ short term down-trend; trading accounts in cash; In a very rare situation, GMI could turn Red after 2 days of Green–monitoring the daily and weekly GMMA charts

GMI2/6
GMI-24/9
T210851%

We are into the period of the post-earnings season lull when there is little to drive stocks higher. With futures down huge this morning, the GMI may close under 3 again and trigger a Red signal. It has been very hard to make $$$ on the long side during the past 10 days since my QQQ short term indicator turned down. I am concerned that the persons who have never experienced a long decline like 2000 and 2008 may be about to get a lesson about market risk. This daily GMMA chart (defined in blog glossary) shows that the QQQ is near to entering a BWR decline. Best to own stocks during a daily RWB up-trend. If we begin a weekly BWR down-trend, the bear will be upon us and I will transfer my university pension money into cash. That will signal the BEGINNING of a major decline. Daily GMMA chart:

Weekly GMMA chart:

Blog post: 7th day of $QQQ short term down-trend; treasury bonds resuming daily BWR down-trend leading to higher interest rates and an end to the bull market; Sell in May?!

GMI1/6
GMI-23/9
T210846%

Higher interest rates always kill the bull. They increase the costs of doing business, slow the economy and give people an ability to abandon risky stocks and to earn decent income from safer interest paying investments. How nice it will be for Boomers to be able to get good interest rates from safer insured CDs. Higher rates will suck the money out of the stock market. Sell in May looks pretty timely this year. The charts will tell us what to do.