All Posts
Day one of new $QQQ short term down-trend; What’s up with $WKHS?
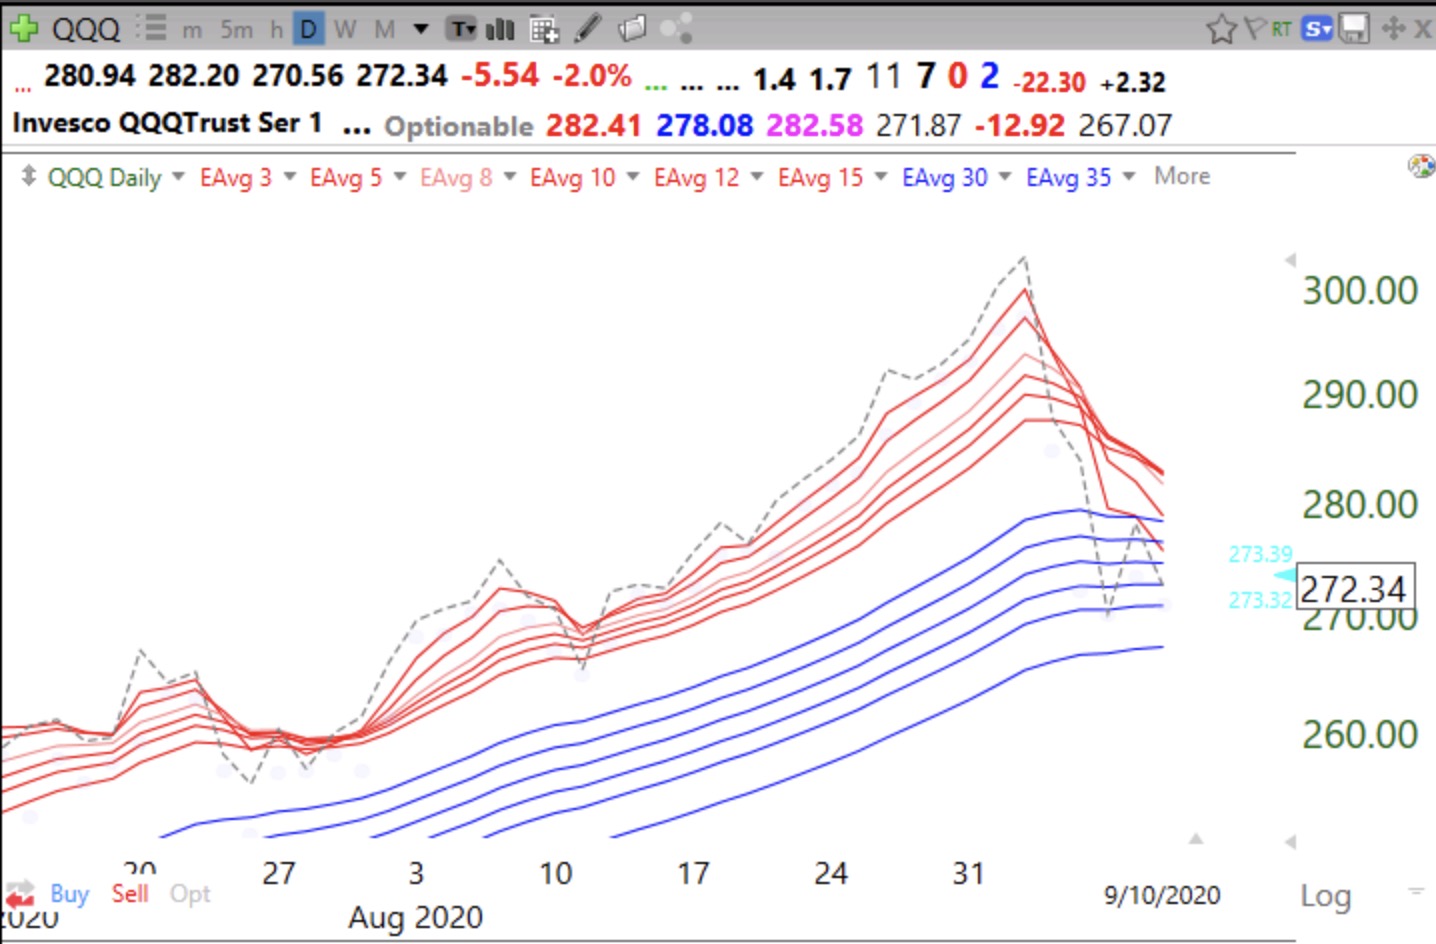
The up-trend that just ended lasted a record (since 2006) 107 days. About 40% of new QQQ short term down-trends end within 5 days. It does not mean a new bear market. But if it lasts for more than 5 days it could lead to a significant decline and I would accumulate SQQQ.
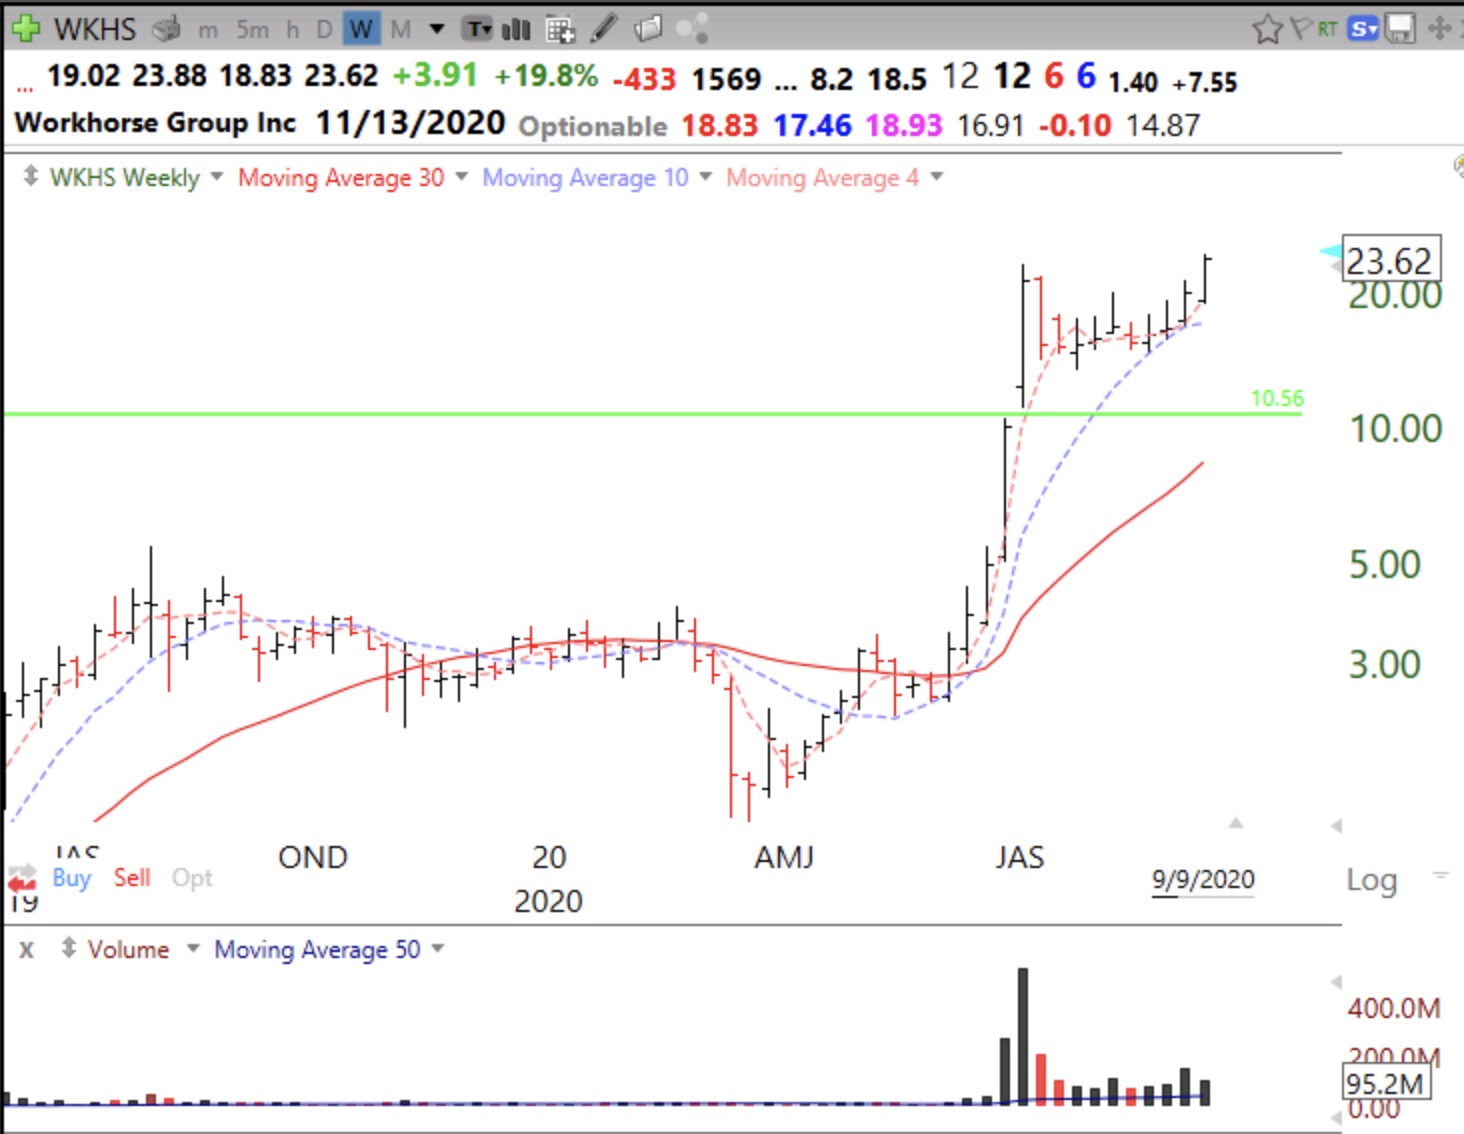
If a stock can hold up after the market’s recent steep decline and break to new all-time highs there must be something going for it. Check out this weekly chart of WKHS, which manufactures electric powered trucks. The stock went vertical, up 7x to a GLB and consolidated for nine weeks and is now moving up again. Flag like patterns like this can be explosive. The move out of the flag can be as large as the preceding flag pole (here about $17).
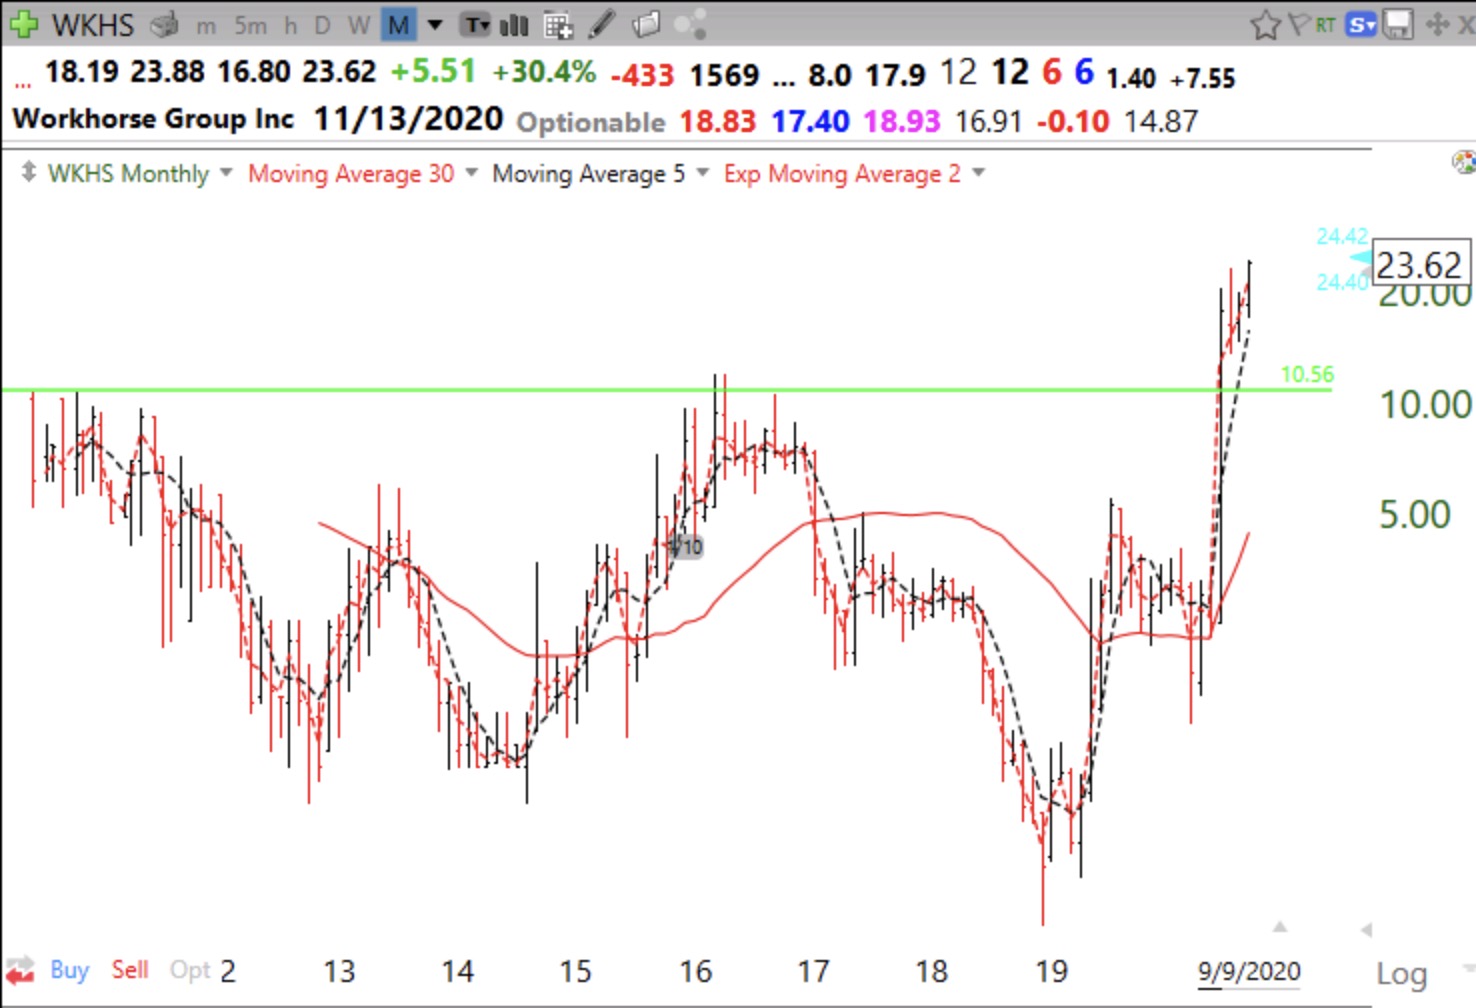
Here is its monthly chart.
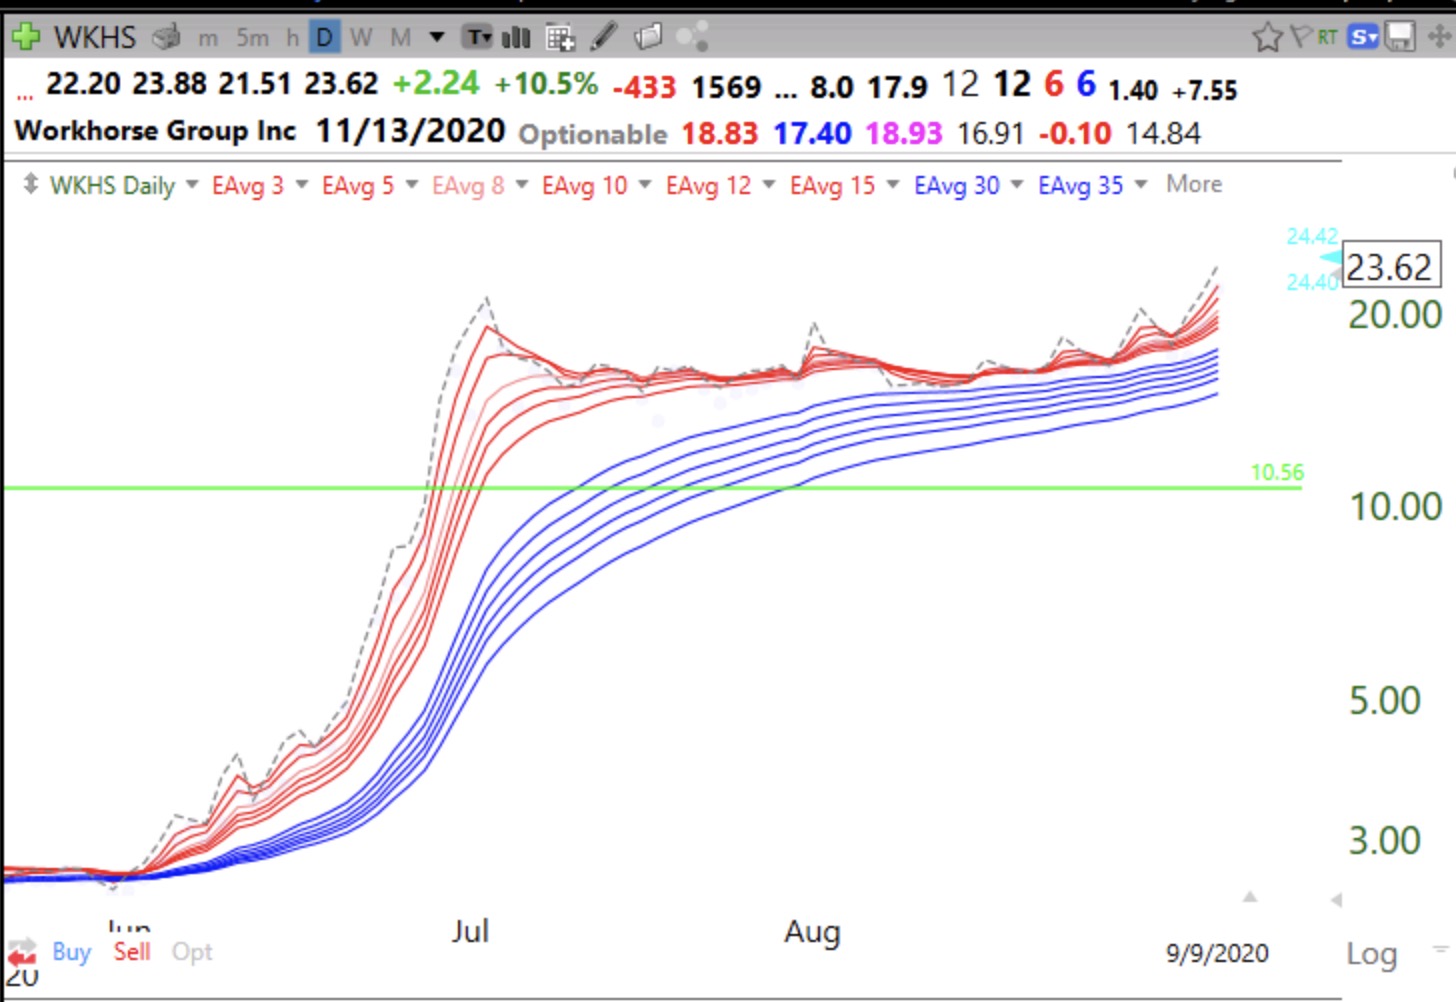
And the daily RWB chart. Note the move up from a multi-month consolidation as shown by the constricted red lines (short term moving averages).
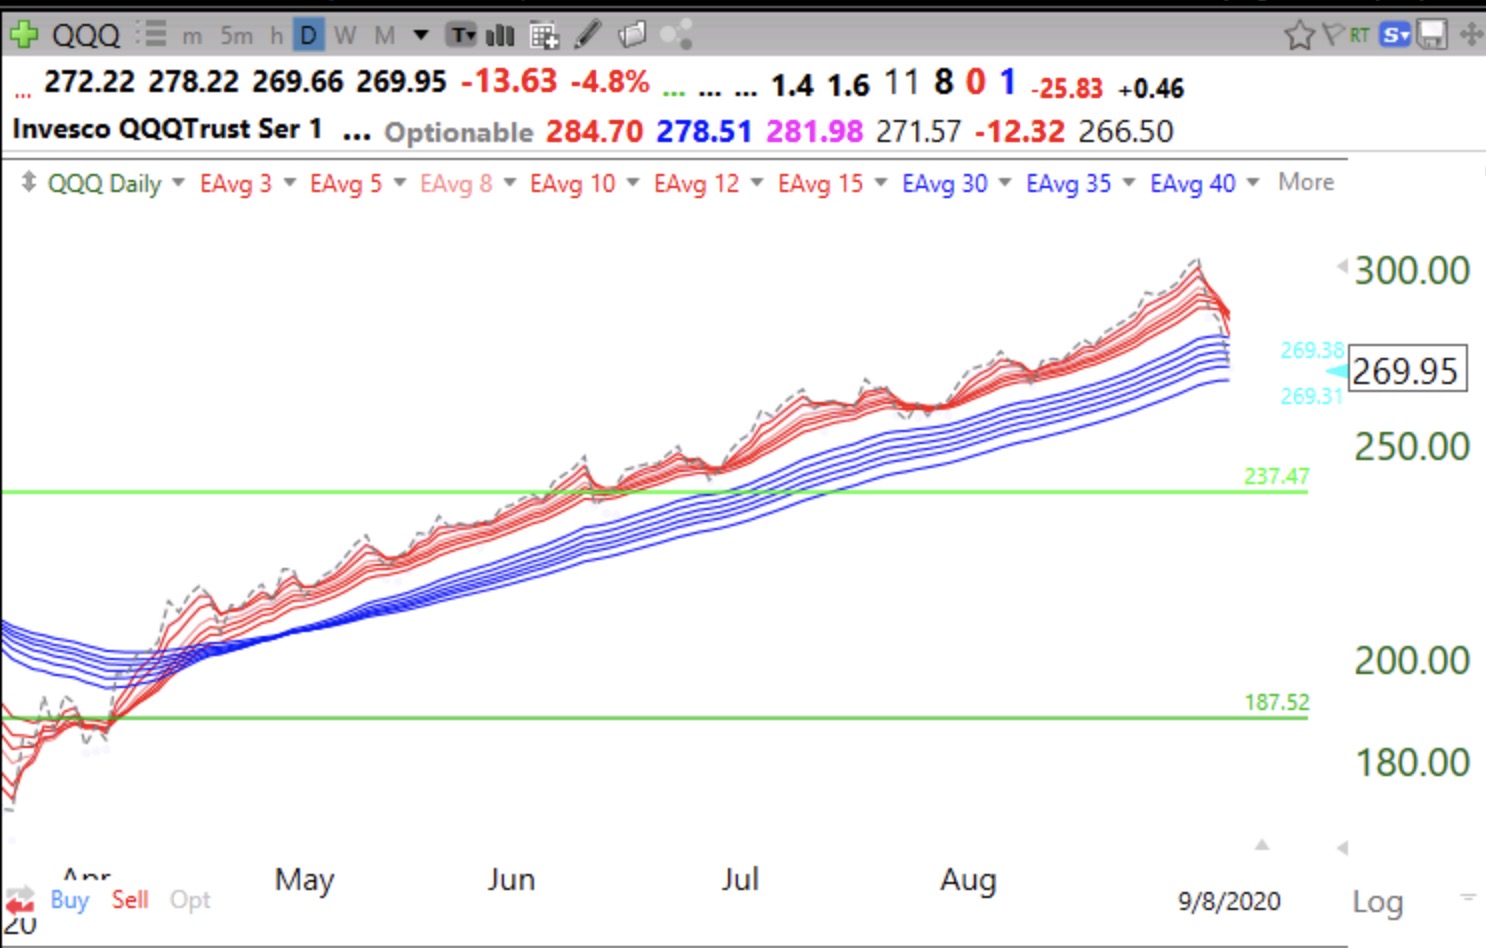
$QQQ Short term up-trend may end Wednesday after record 108 days, along with end of daily RWB up-trend
Daily red/white/blue (RWB) up-trend pattern is when all short term exponential moving averages (red lines) are rising above all longer term averages (blue lines) with a white band separating them. Gray dotted line shows daily close, which leads averages up or down. Note dotted line is now among blue lines. When daily close retakes the red lines it could signal a possible start of a new up-trend. A major down-trend occurs when one has a BWR pattern, last seen in early April.