All Posts
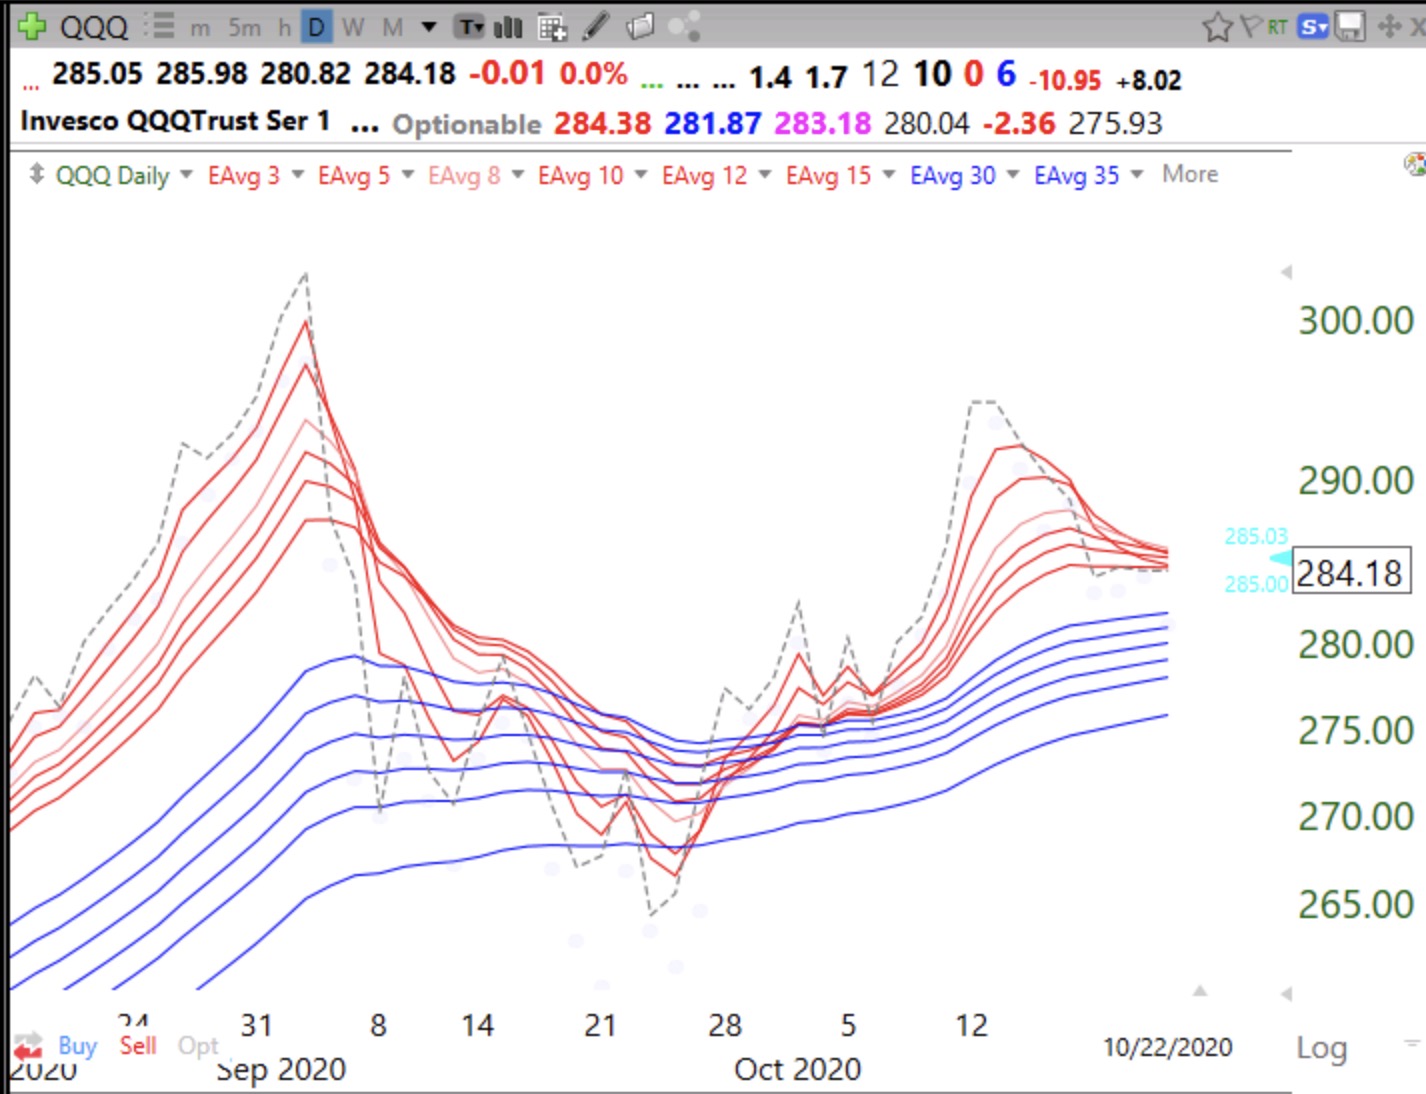
9th day of $QQQ short term up-trend; 3 bagger $NFE tracks 4 week average and has beautiful daily RWB pattern
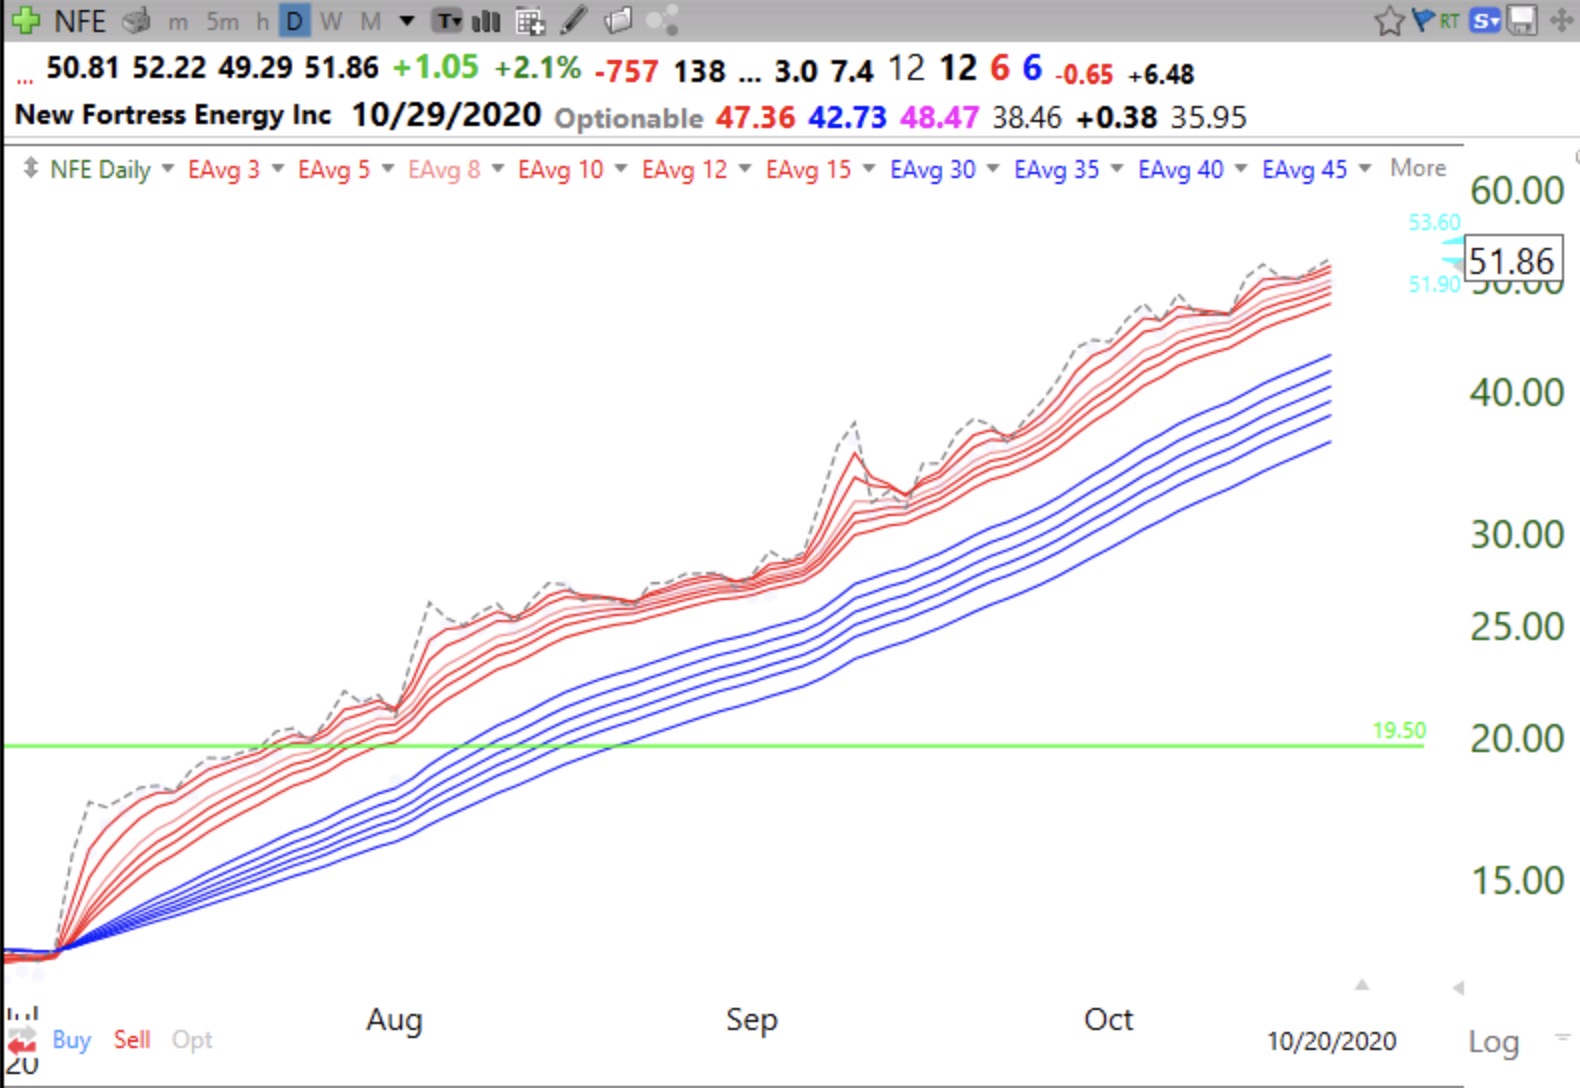
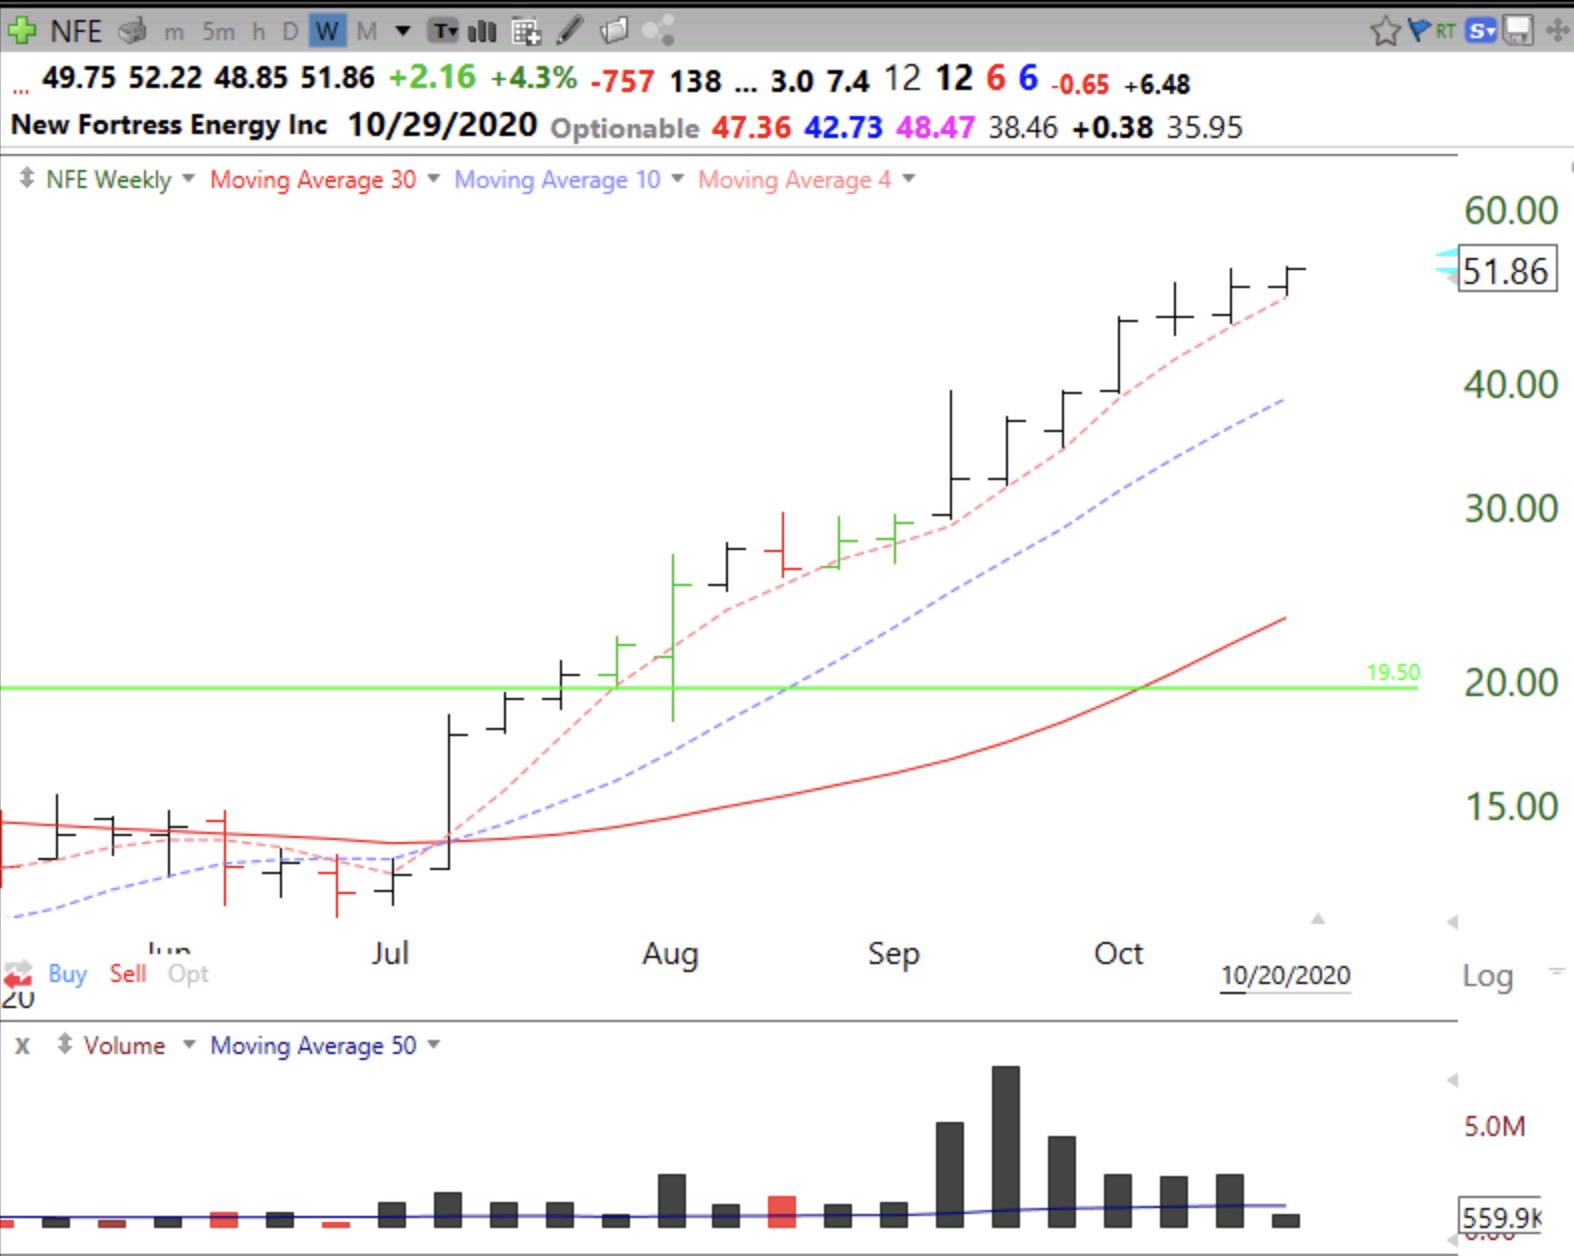
I wrote a few days ago how I used the iBD screener to identify stocks with great fundamentals. I noted tonight that one of them reached an all-time high on Tuesday. When you look at this weekly chart you can see how nicely NFE tracks its 4 week average (red dotted line). Many advancing stocks follow their 4 week average for months. Since its above average volume GLB in August, NFE has closed each week above its 4 week average for 12 straight weeks. It has tripled over the past year. The last 3 quarters NFE has had triple digit increases in sales and is predicted to turn a profit in 2021.
It also has a perfect daily RWB pattern.