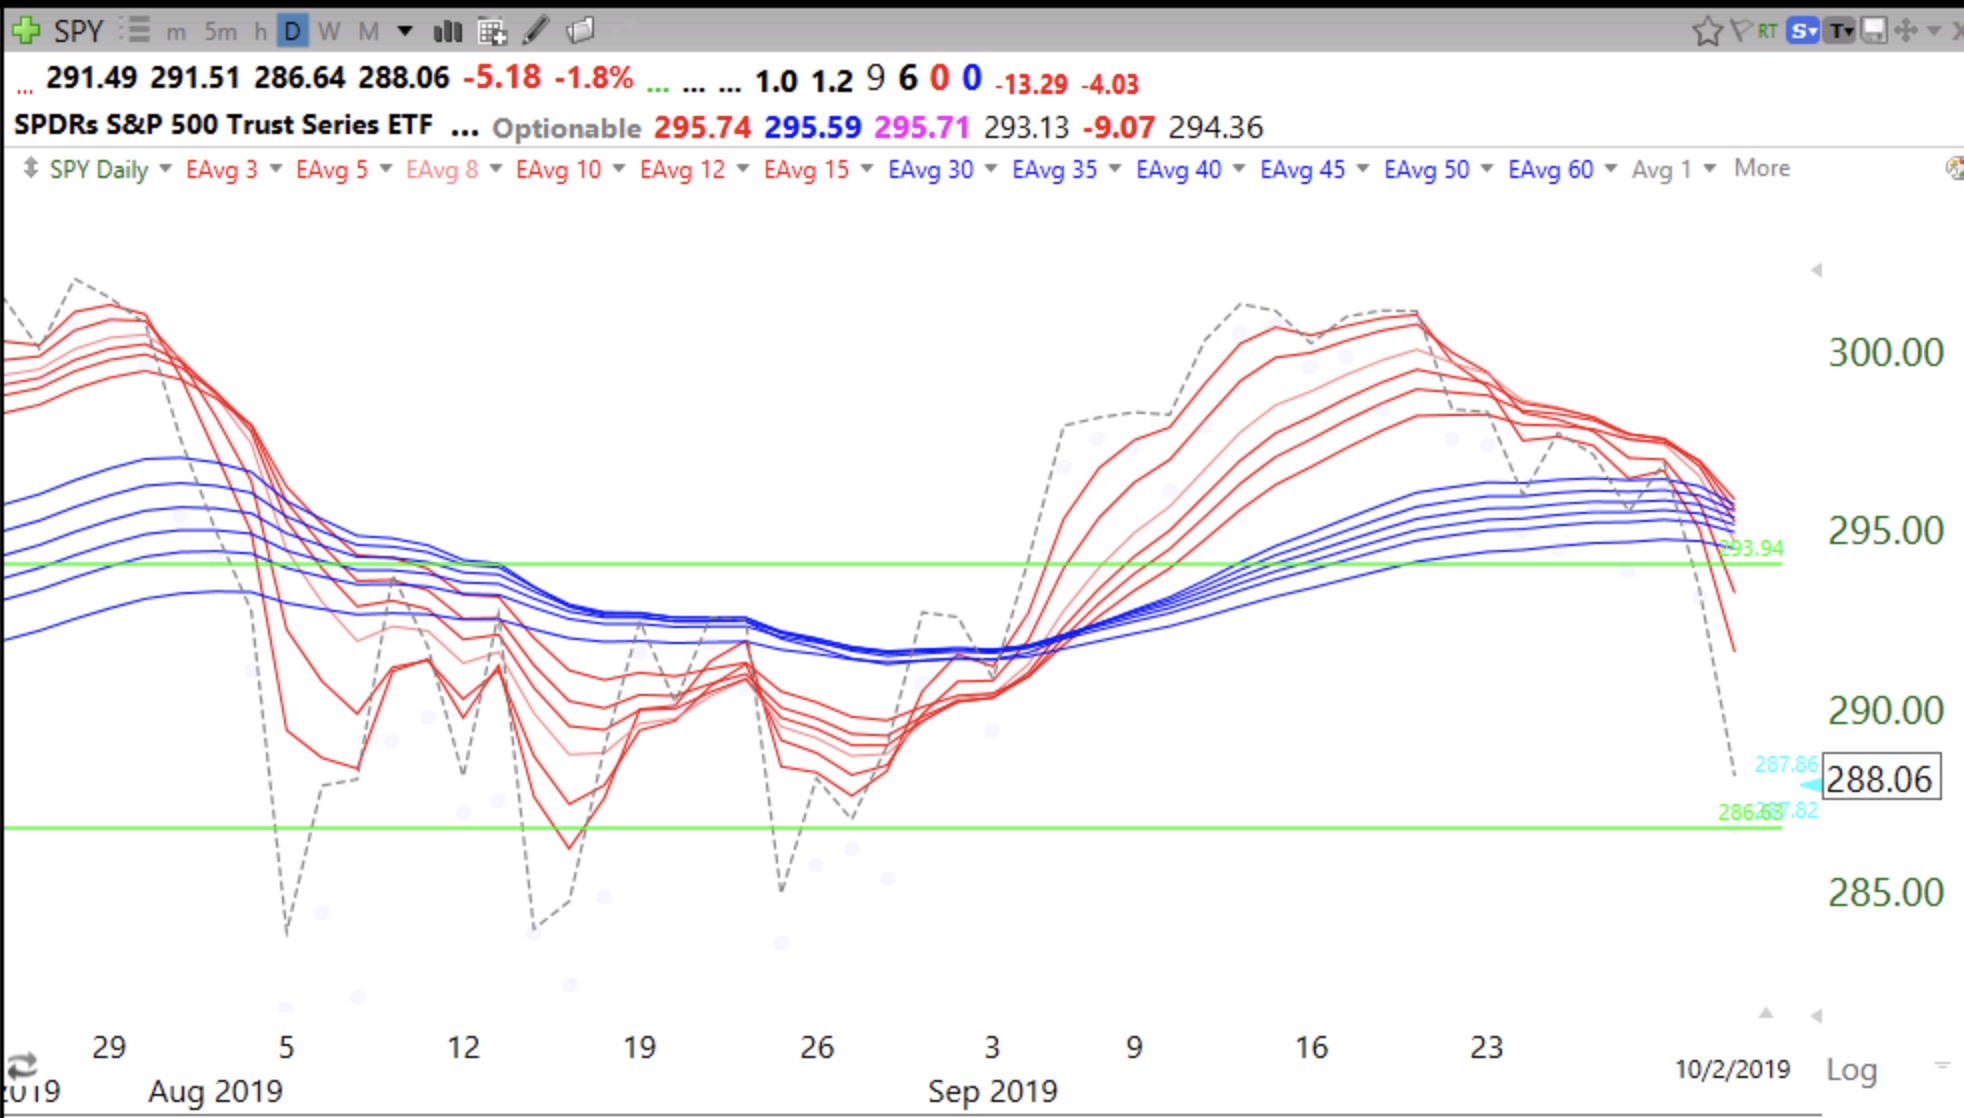
SPY looks very weak. Will it form an ominous daily BWR pattern?
Stock Market Technical Indicators & Analysis
SPY looks very weak. Will it form an ominous daily BWR pattern?
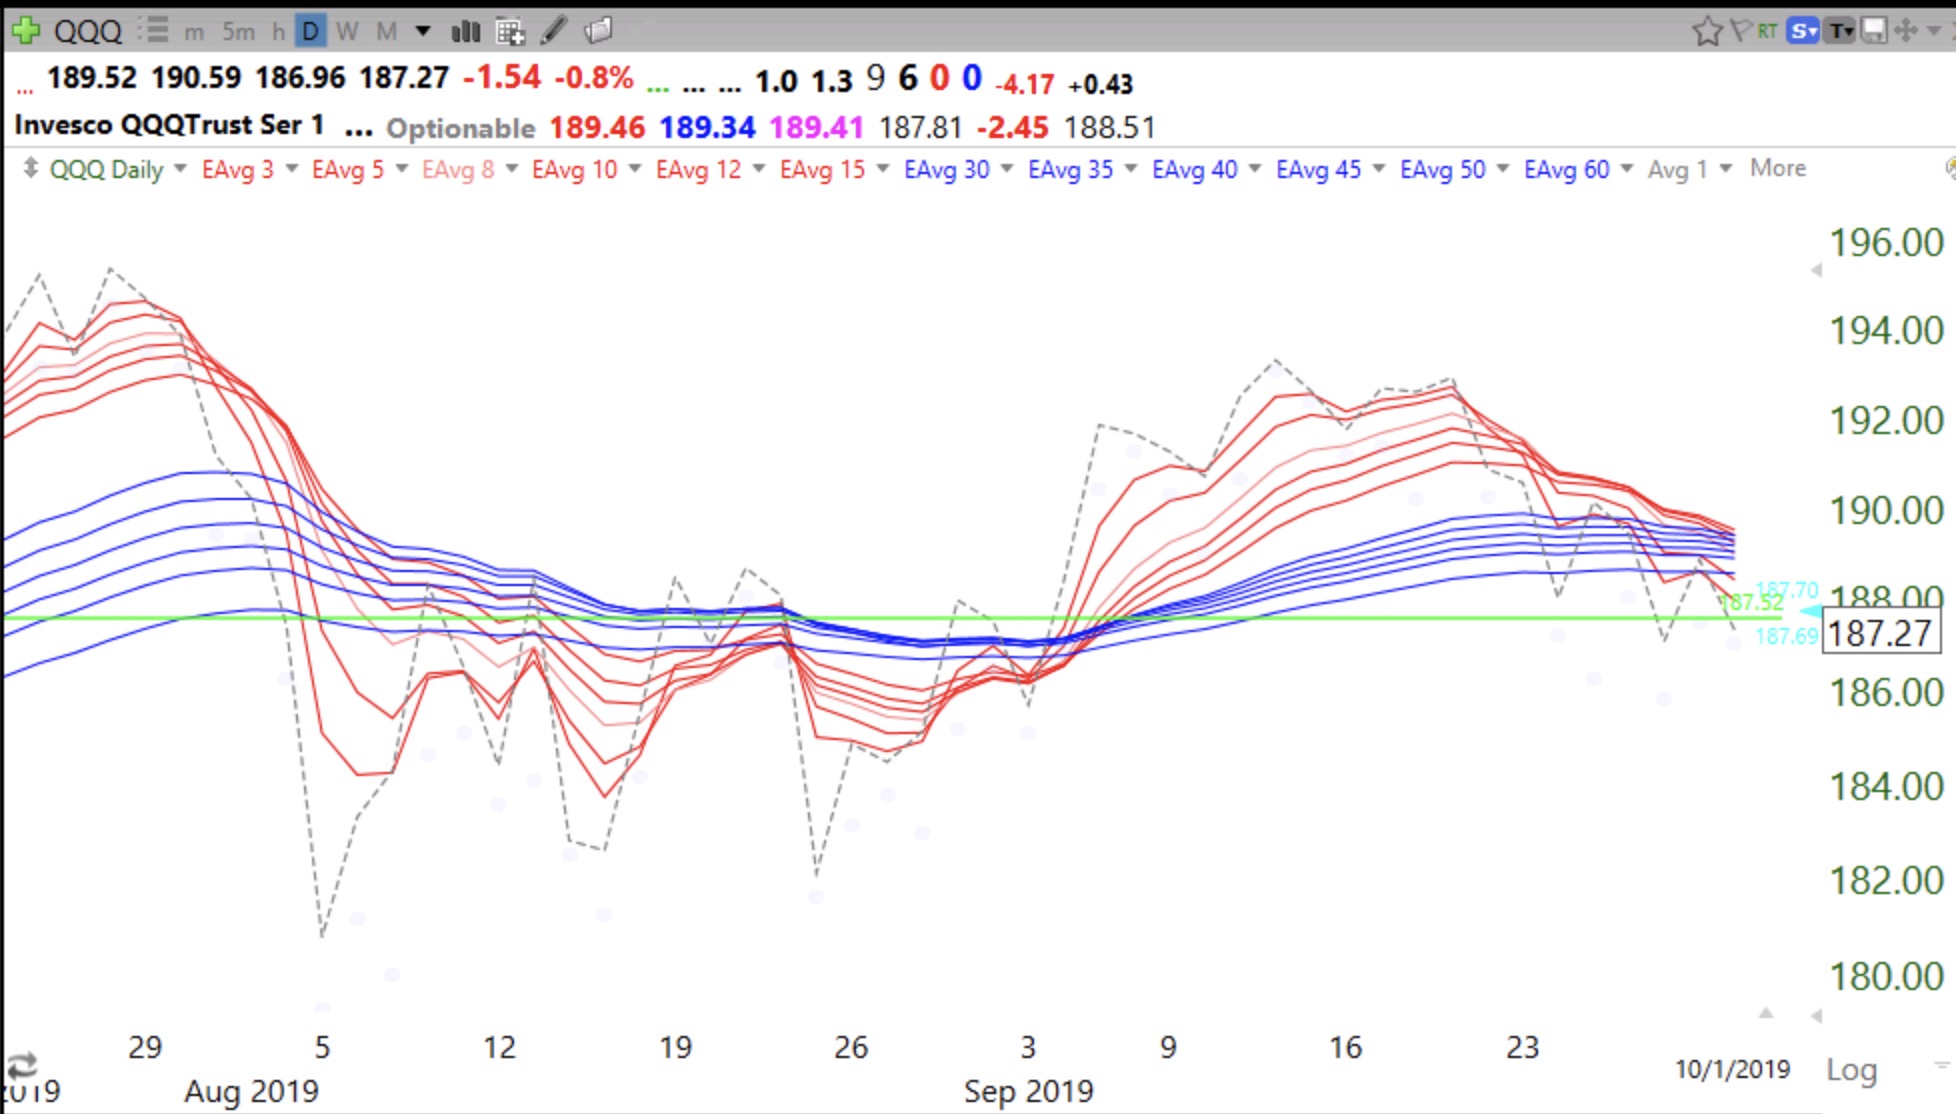
Twice as many new lows than new highs. Time to be short or out in my trading accounts. QQQ closed below (dotted line) all 12 averages.
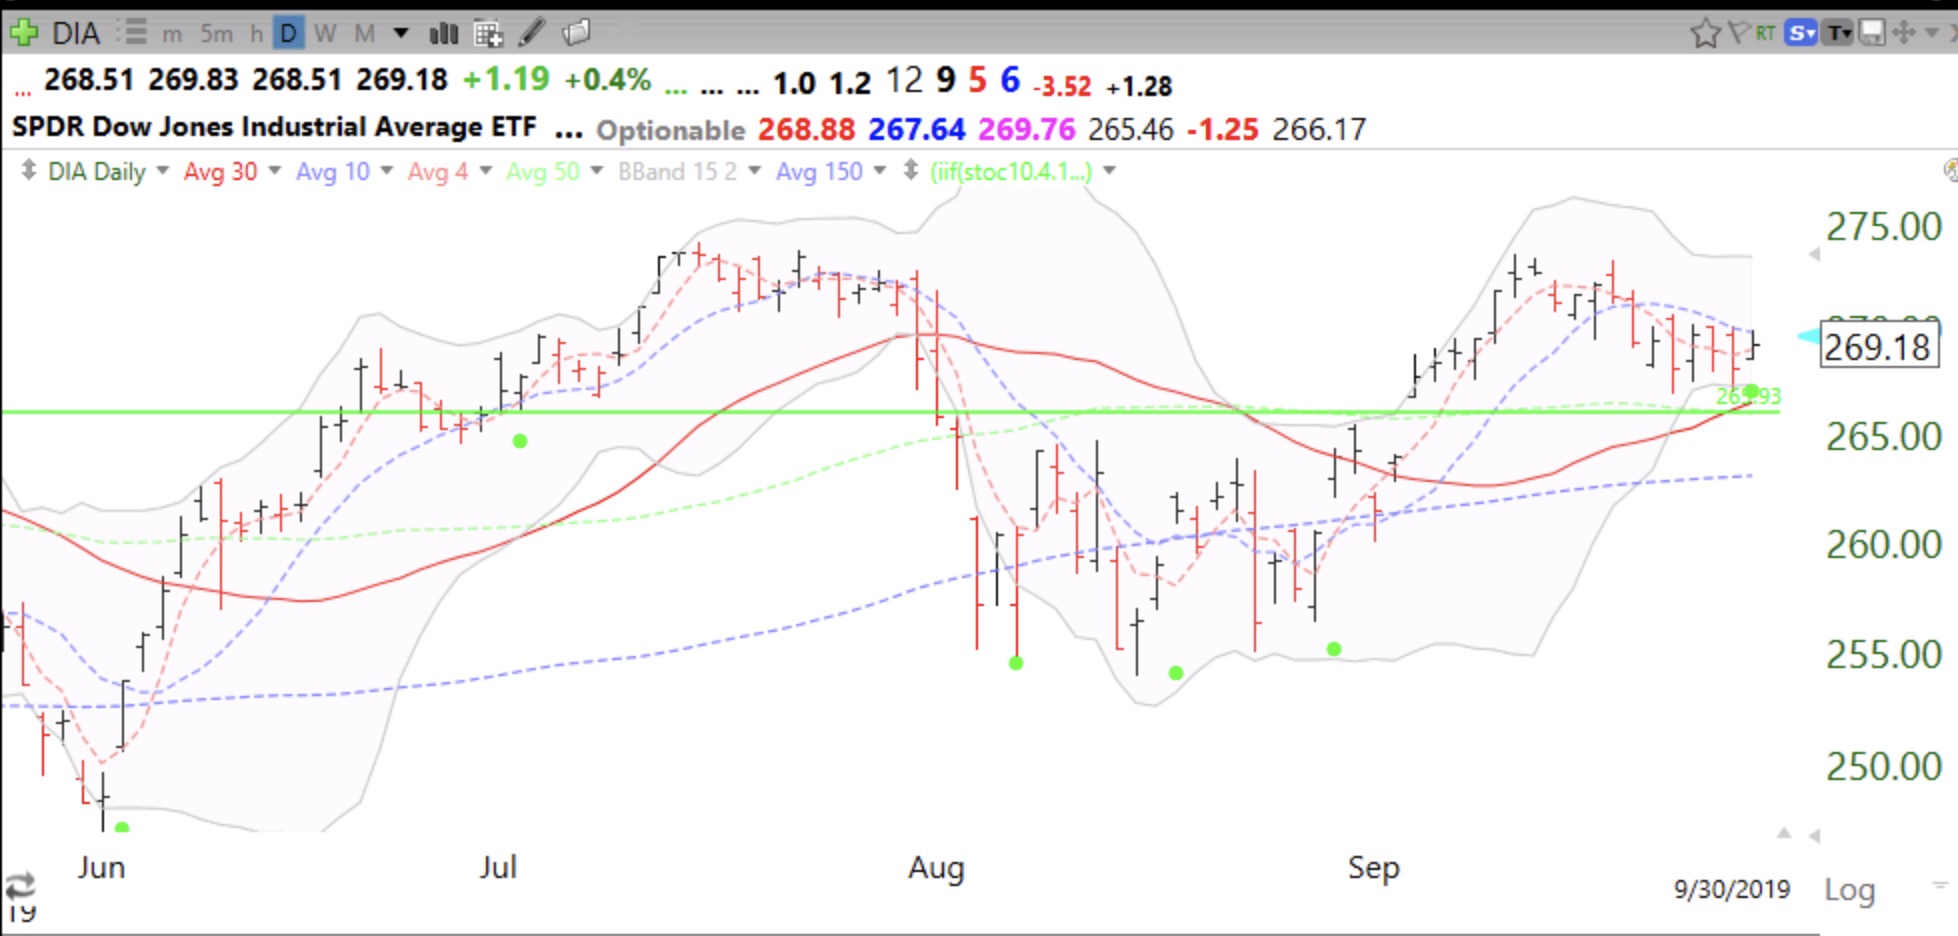
It is too early to tell whether the new down-trend is tradable. Tomorrow’s action will tell whether the GMI flashes a Red signal. Note that the QQQ, DIA and the SPY had green dot signals. Is this a cup with handle? Go figure………