Skip to content

Wishing Wealth Blog

Stock Market Technical Indicators & Analysis

  • Home
  • About
    • Disclaimer
    • Contact
  • Recommended Reading
  • Topics
    • General Market Index (GMI) table
    • Nicolas Darvas
    • My Favorite Posts
    • Tutorial
    • UMDSMC Education Posts
    • Video blog
  • Webinars
    • TraderLion 25 Annual Conference
    • 2025-07-17 Long Island Traders Meetup
    • Boston IBD Meetup, May 21, 2025
    • 01/2024 NoVA IBD Meetup
    • AAII
      • Eastern Michigan – 01/2022
      • Research Triangle – 12/2021
    • 2021 TraderLion Presentation
    • 2022 TraderLion Webinar
    • TC2000 User Group – December 2012
    • 2012 Houston TC2000 Webinar
    • Doctor’s Orders – August 2010
    • A Word from Dr. Wish – April 2010
    • Other Dr. Wish Videos…
  • Glossary
  • $25 Coupon for TC2000

All Posts

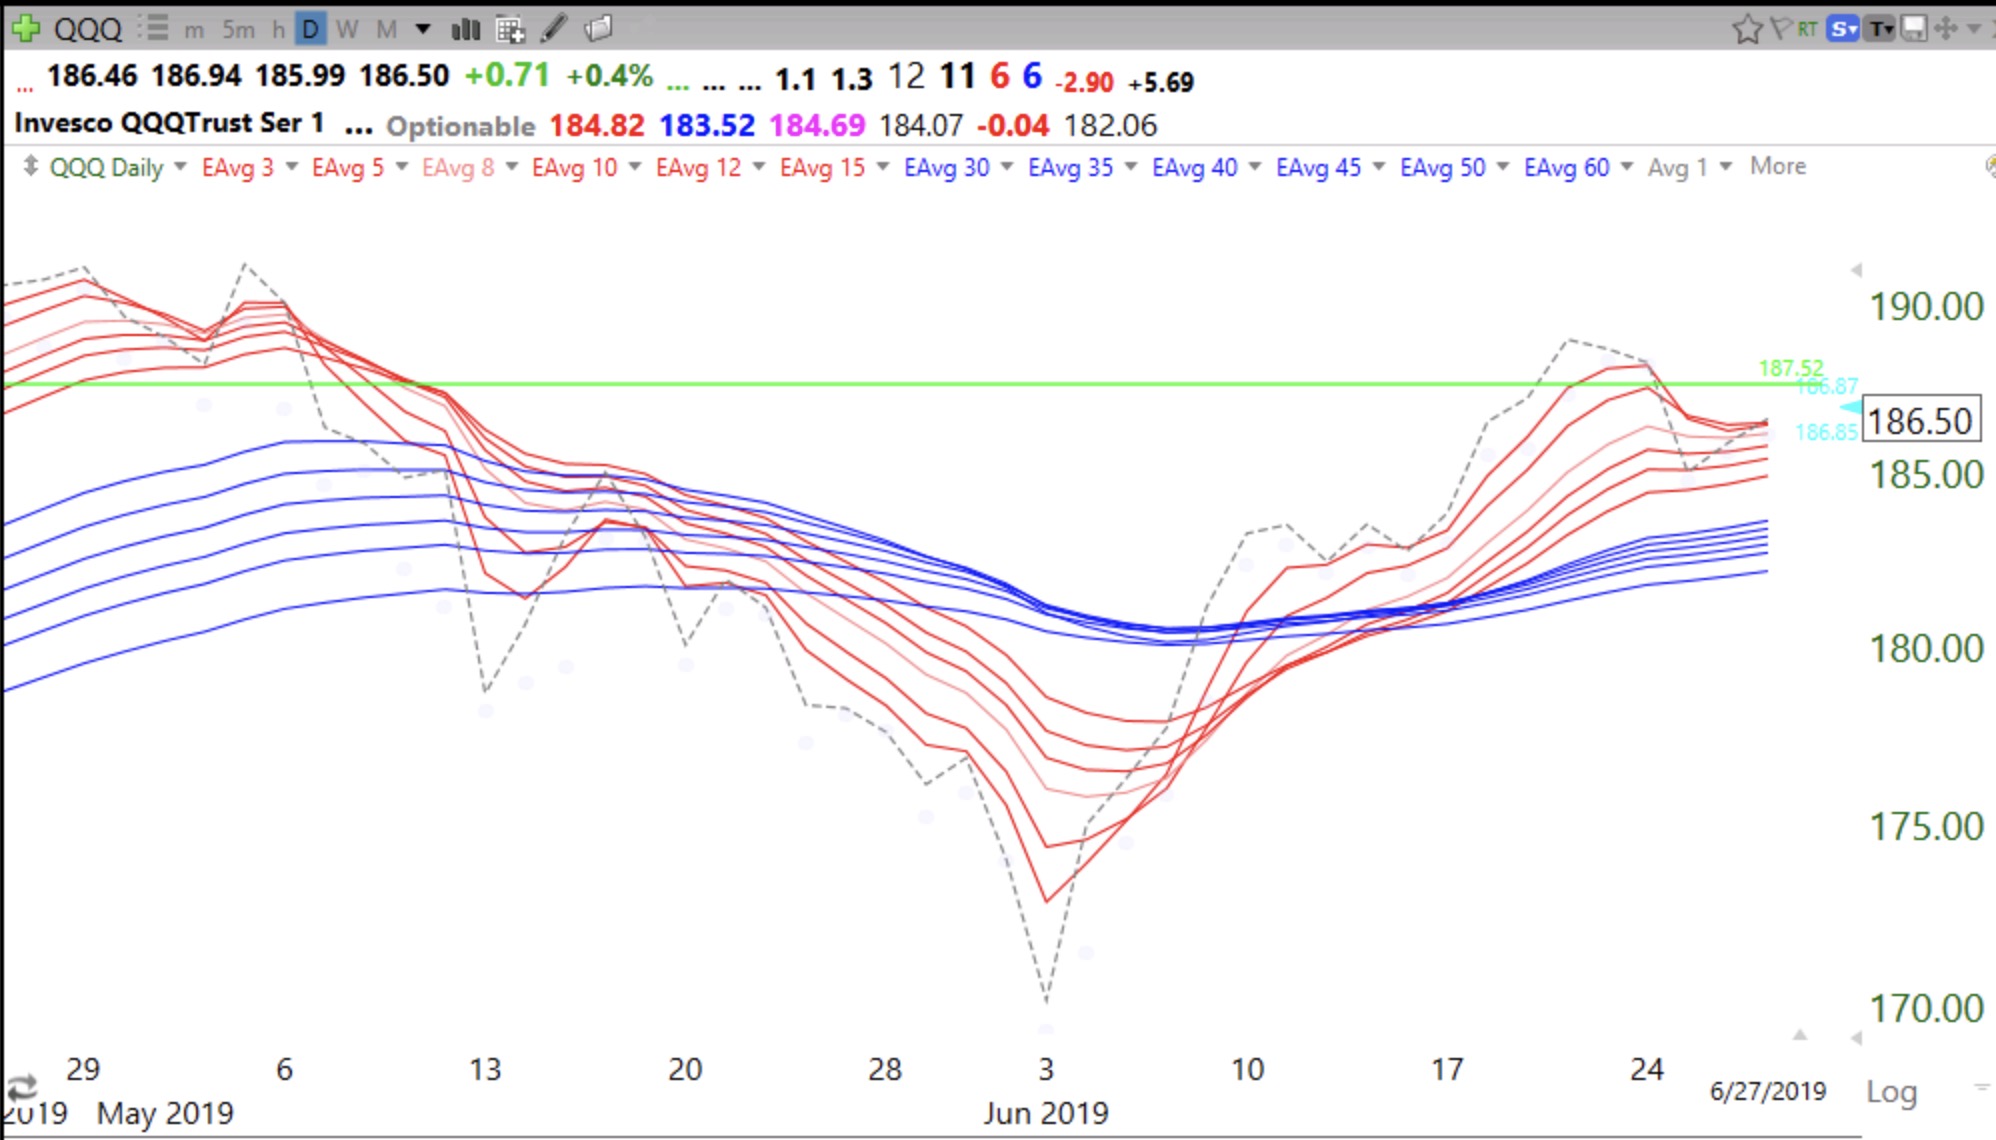
13th day of $QQQ short term up-trend; Daily RWB up-trend intact

Friday, June 28, 2019 @ 8:15 am by Dr. Wish
GMI4/6
GMI-25/9
T210852%

Leave a comment

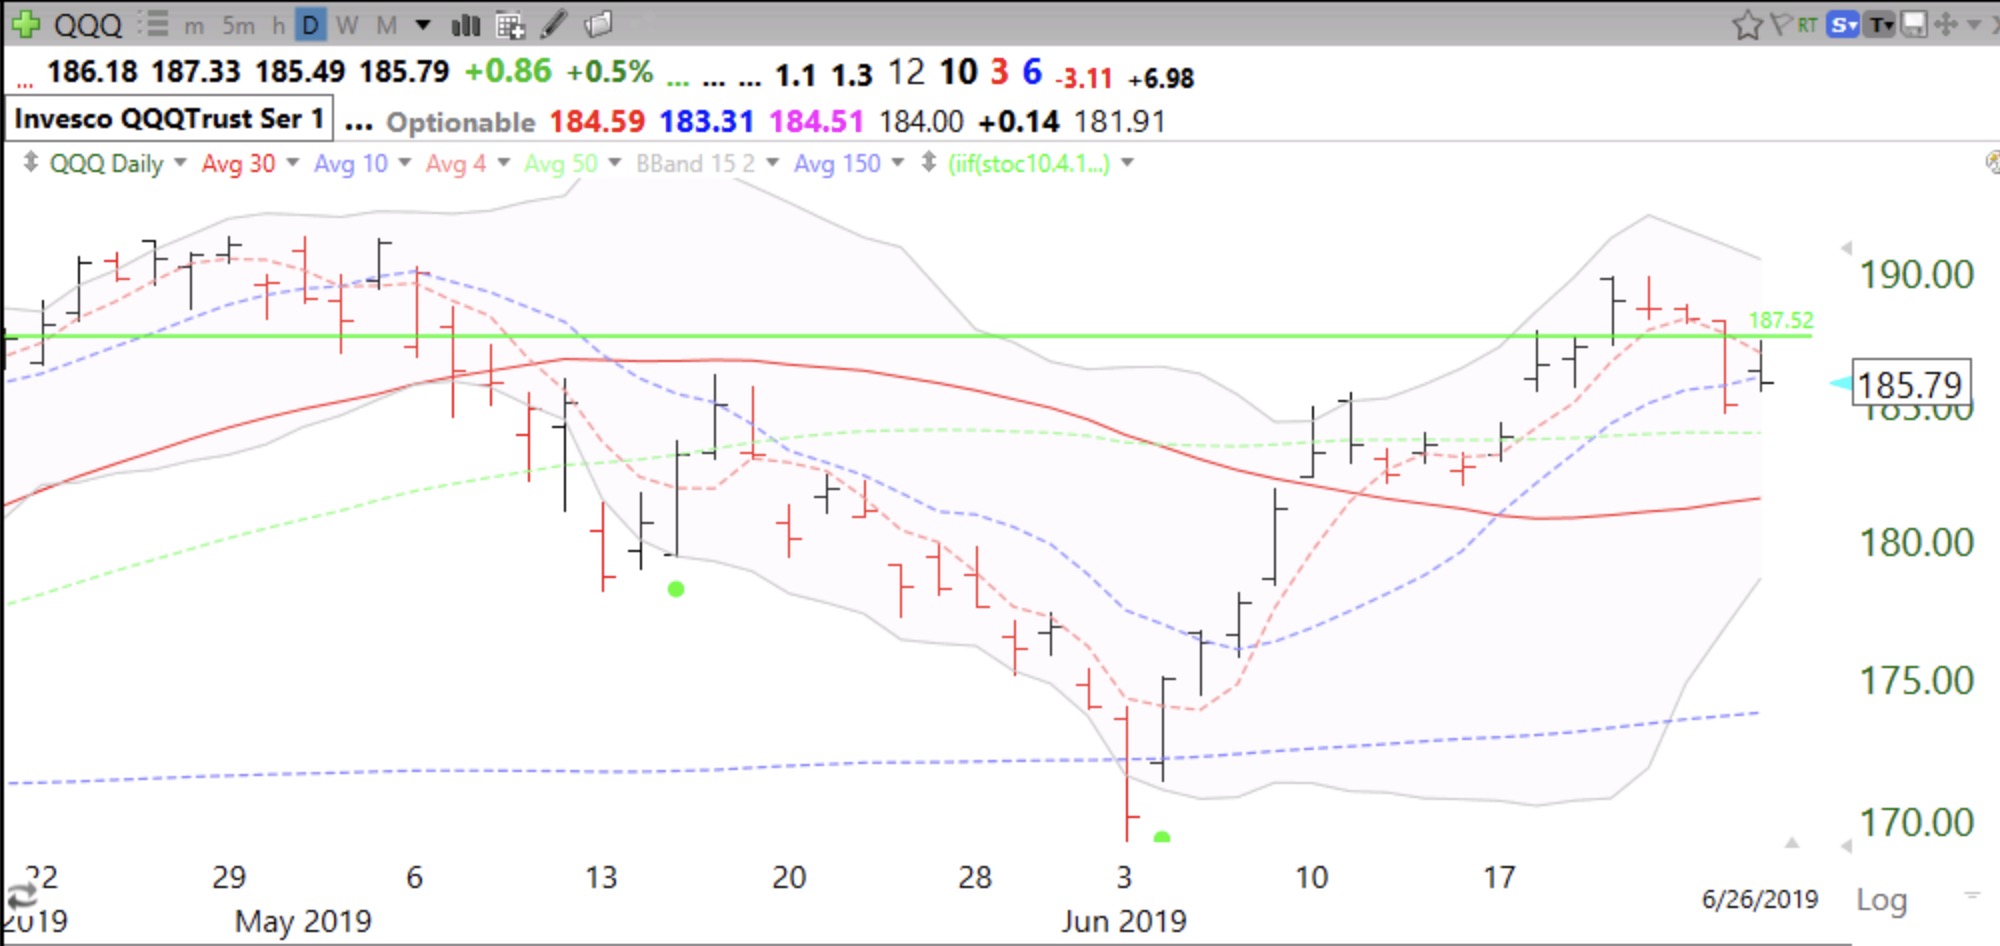
12th day of $QQQ short term up-trend

Wednesday, June 26, 2019 @ 10:34 pm by Dr. Wish
GMI4/6
GMI-24/9
T210846%

Leave a comment

10th day of $QQQ short term up-trend

Monday, June 24, 2019 @ 10:02 pm by Dr. Wish
GMI6/6
GMI-27/9
T210849%
Leave a comment
Older posts
Newer posts
← Previous Page1 … Page374 Page375 Page376 Page377 Page378 Page379 Page380 … Page1,372 Next →

Current GMI Signal

GREEN

since close on May 5, 2024

Successful GLBTracker

Selected stocks that have had a successful recent Green Line Breakout (GLB). One can really profit by buying stocks breaking out to all-time highs after a consolidation of 3 months or more, my GLB Setup.

Sym.DateGLB $Now $Chg.
HWM11/14/23$51.34$202.42294.27%
SFM1/29/24$49.45$106.59115.55%
CRS4/23/24$79.66$313.14293.10%
AGX9/6/24$76.70$295.00284.62%
BKNG9/16/24$3,918.00$5,252.9134.07%
APP9/17/24$116.09$642.95453.84%
DUOL9/18/24$245.87$309.7725.99%
EAT10/1/24$78.33$125.5160.23%
NFLX10/18/24$700.99$1,096.9156.48%
LRN10/23/24$69.70$152.98119.48%
PLTR11/5/24$44.91$189.71322.42%
SPOT11/6/24$387.44$658.6169.99%
CRWD4/24/25$398.33$529.7132.98%
CLS5/1/25$87.00$303.00248.28%
RGC5/1/25$1.55$16.52965.81%
CCJ6/9/25$62.55$86.6038.45%
SEZL5/9/25$79.59$75.47-5.18%
CRWV5/14/25$64.62$135.80110.15%
GEV5/20/25$447.50$585.9430.94%
NVDA6/3/25$140.76$190.9335.64%
MIRM8/7/2025$54.23$71.3031.48%
CCJ6/9/25$62.55$86.6038.45%
ORCL6/12/25$198.31$281.2641.83%
QBTS5/20/25$13.23$35.12165.46%
IONQ9/12/25$54.74$62.7014.54%
HOOD6/30/25$85.60$146.7471.43%
IREN9/9/2025$28.25$64.85129.56%

Indicators in your Inbox

Get new posts by email:
PopularMost DiscussedRecent
  • About the General Market Index (GMI)
  • Welcome to the new *and improved* Wishing Wealth
  • How to use IBD 100 and New America stocks and TC2007 to find potential rocket stocks; Market rally begins
  • The new 3x ETF’s–triple your pleasure — or pain
  • My first YouTube Vlog (video blog) Post: Sell in May and Go Away?
  • In the hospital. Will resume posting next week. Thank you for your patience.
  • How I use put options as investment insurance
  • My first YouTube Vlog (video blog) Post: Sell in May and Go Away?
  • So, Wishing Wealth Reader, Tell Us About Yourself…
  • Blog post: David, my co-presenter, brilliant colleague of 20+ years died in a freak accident on 2/18; Day 35 of $QQQ short term down-trend; 15 promising stocks to monitor
  • Blog Post: Day 44 of $QQQ short term up-trend; $AAPL retakes green line, see daily chart. The GMI=6 (of 6) and Green, see Table.
  • Blog Post: Day 43 of $QQQ short term up-trend; “Come Back at Halloween.” Barring bad inflation news Friday, my indicators suggest a continuing up-trend, see weekly chart and explanation.
  • Blog Post: Day 42 of $QQQ short term up-trend; $AAPL has failed GLB, earnings next week, be careful of failed setups.
  • Blog Post: Day 40 of $QQQ short term up-trend; Up-trend continues, GMI=6 and $AAPL has a GLB after a Blue Dot of Happiness signal, see daily chart.
  • Blog Post: Day 39 of $QQQ short term up-trend; Much weakness on Friday: more new lows than highs and only 8 at ATH, lowest since April 24! Another possible head and shoulder’s top forming, see daily chart. GMI=4 but Green, see table.

Blogroll

  • Barchart All-Time Highs
  • Blue Collar Investor
  • CNNMoney: Pre-market Futures
  • Dark Liquidity
  • Seeking Alpha
  • Stock Chartist

Recommended Reading

QQQ and TQQQ ETF Profit Machine Momentum Masters - A Roundtable Interview with Super Traders - Minervini, Ryan, Zanger & Ritchie II Alan Ellman's Selling Cash-Secured Puts: Investing to Generate Monthly Cash Flow Stock Investing For Students - a plan to get rich slowly and retire young Trade Like a Stock Market Wizard: How to Achieve Super Performance in Stocks in Any Market Exit Strategies for Covered Call Writing: Making the Most Money When Selling Stock Options Complete Encyclopedia for Covered Call Writing Wall Street The Other Las Vegas How to Make Money in Stocks: A Winning System in Good Times and Bad, Fourth Edition Trend Trading: A seven step approach to success How Legendary Traders Made Millions: Profiting From the Investment Strategies of the Gretest Traders of All time The Complete TurtleTrader: The Legend, the Lessons, the Results How to Make Money Selling Stocks Short Reminiscences of a Stock Operator Stan Weinstein's Secrets For Profiting in Bull and Bear Markets Lessons from the Greatest Stock Traders of All Time How I Made $2,000,000 In The Stock Market

Archives

© 2025 WishingWealthBlog.com
 

Loading Comments...