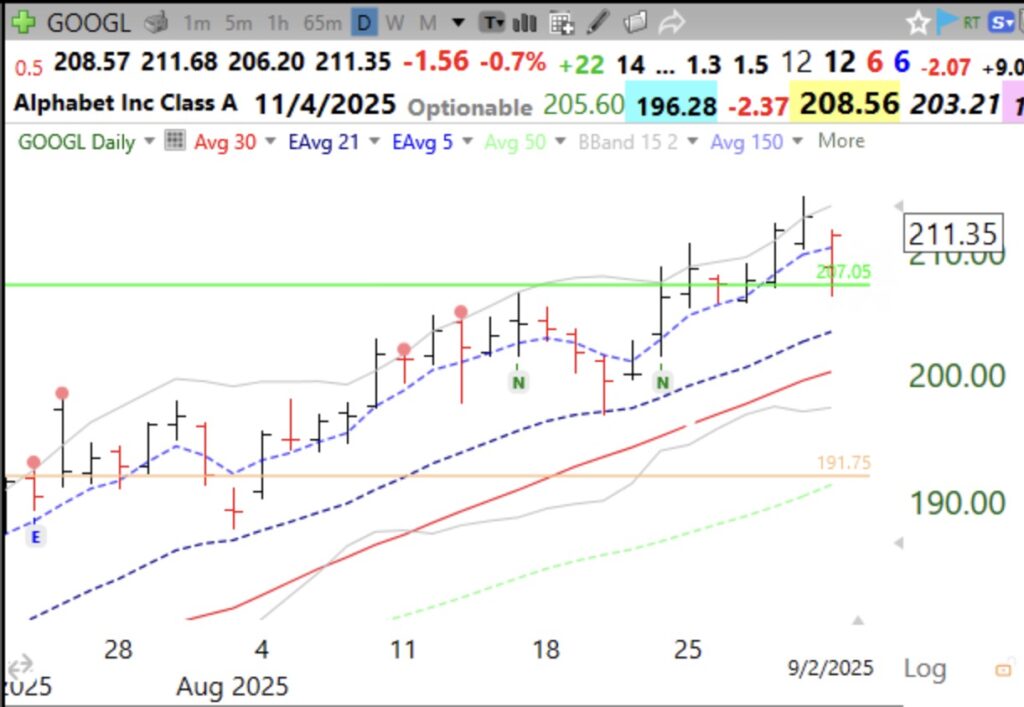
When a stock holds up while many other stocks are declining it is telling you something. GOOGL news broke that will likely propel the stock higher tomorrow. GOOGL held its green line through the recent market volatility. Some traders likely knew the news before it came out. A GLB should be held until the stock CLOSES below the green line. On Tuesday GOOGL traded intraday below the green line but closes above it near the day’s high. It has closed above the green line for 6 straight days.
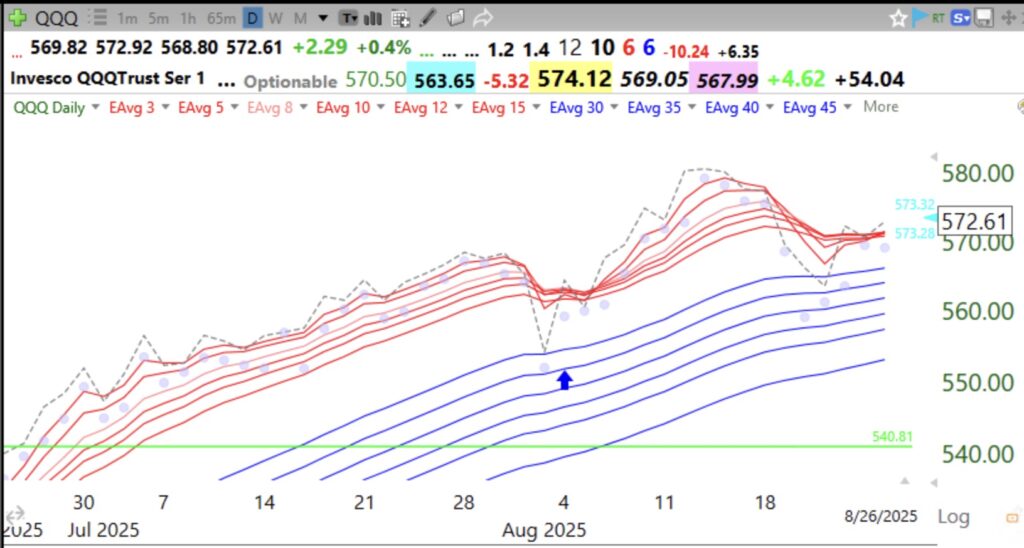
While I can think of many reasons why the market will not remain bullish now, I am ignoring them and following my rules. We finished day 4 of the new QQQ short term up-trend and Friday will reach Day 5. I have repeatedly found that if I just held TQQQ from early in a new QQQ short term up-trend I would have outperformed most individual stocks. So I bought a little TQQQ on Day 1 and am slowly adding more. I may buy more again on Friday when it will likely reach Day 5. One has to move quickly with the leveraged ETFs and limit losses, however. See Les Masonson’s excellent recently published book on the topic.
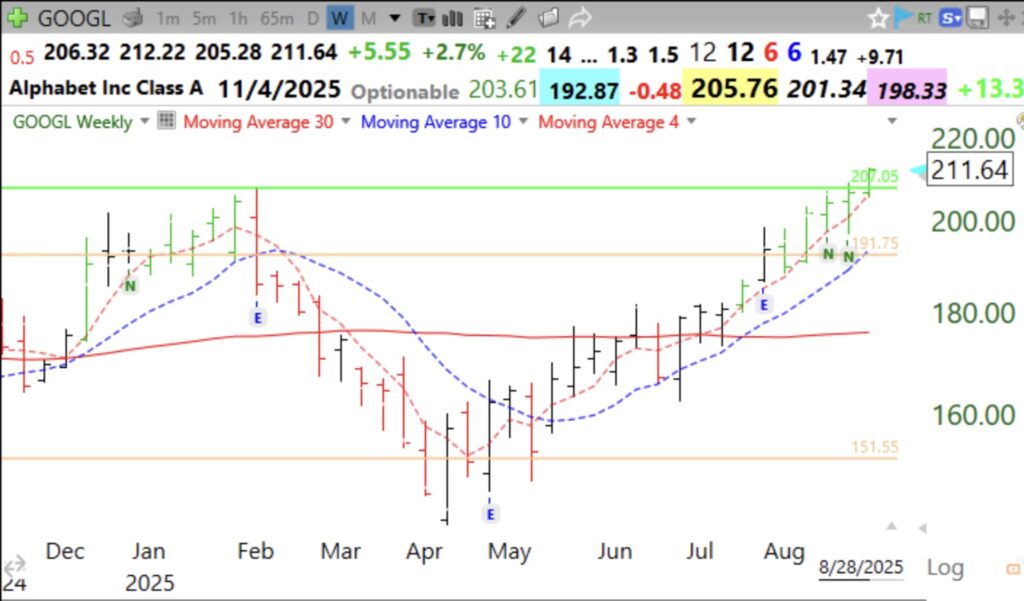
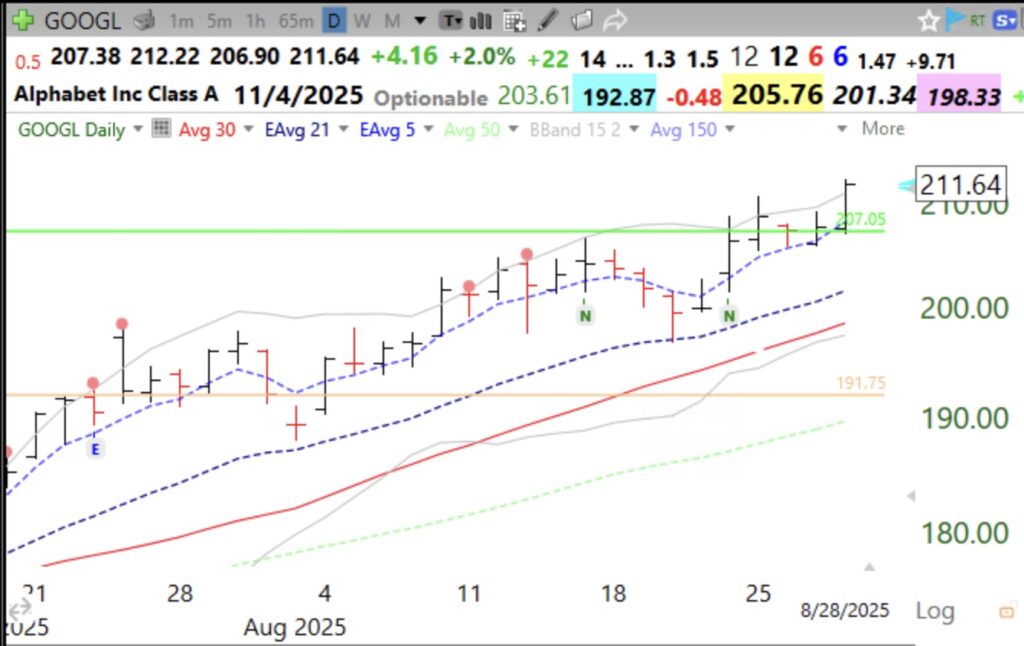
I am also holding some GOOGL. GOOGL had a recent GLB and is holding the green line (207.05). How nice to ride such a leader, for now. See the weekly chart below. Note GOOGL has been riding above its rising 4 wk avg (pink dotted line) for 10 straight weeks. This is the pattern of an advancing stock. See also its daily chart. If GOOGL CLOSES back below the green line, it is a failed GLB and I will exit immediately.
The gray dotted line is the daily close. All shorter term red averages are above the blue longer term averages with a white space between them (RWB) up-trend. If the new up-trend continues more than 5 days, I will accumulate more TQQQ. Many of my setups have begun to work again, a good sign of market strength. The GMI is back to 6 (of 6), another sign of strength.