5th day of $QQQ short term down-trend; $TFX bounces.

GMI4/6
GMI-21/9
T210875%

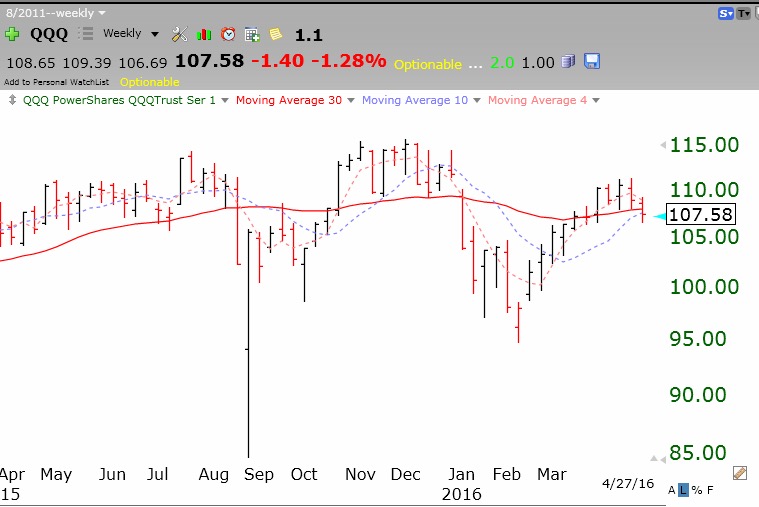
A lot of rocket stocks bounced from oversold support on Monday. This may be a playable bounce.

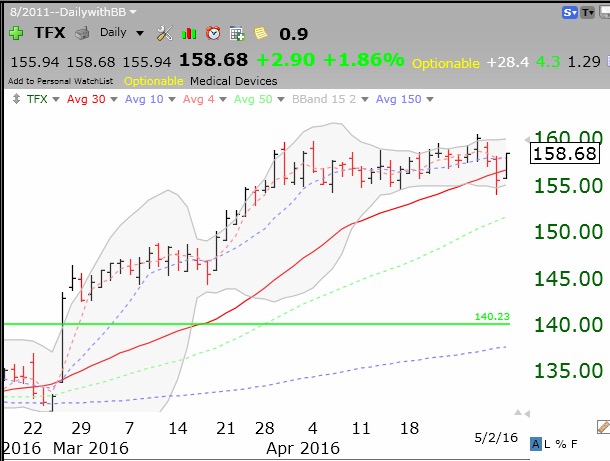
For example, TFX, which I bought on Monday,  has bounced from 1ts 15.2 lower Bollinger Band and retaken its 30 day average.  I call this a low risk set-up. If the bounce fails to hold  I exit and take a small quick loss. Note that TFX is above its recent green line top.

Screen Shot 2016-05-02 at 8.44.41 PM


3rd day of $QQQ short term down-trend; heed earnings day

GMI5/6
GMI-21/9
T210876%

It is embarrassing to see that one of the GLB stocks I posted in my new GLB tracker table , IPGP,  fell 15% the next day. This brings up a very important lesson I teach my students. Always know the expected earnings release date for all stocks held or to be purchased. In these very volatile days, I usually sell my position before  earnings day. Otherwise, I am merely gambling. On the other hand, those gamblers who held LNKD or AMZN through earnings were greatly rewarded!

Tech stocks leading market down–Sell in May? New GLB tracker….

GMI5/6
GMI-22/9
T210881%

Wednesday was the 2nd day of the new $QQQ short term down-trend. The QQQ has now closed below its 10 week and 30 week averages. Maybe it is a major head and shoulders top? And here comes the dreaded Sell in May period. It is time to get defensive, at least with the tech stocks. Here is the foreboding weekly chart of the QQQ.

Screen Shot 2016-04-28 at 5.09.05 AM

Check out the new GLB performance tracker to the right. It will enable me to see how well GLB stocks have performed. GLB stocks do well in an advancing market but do poorly in falling markets. Failing GLB stocks can also give advance warning of an imminent market decline.