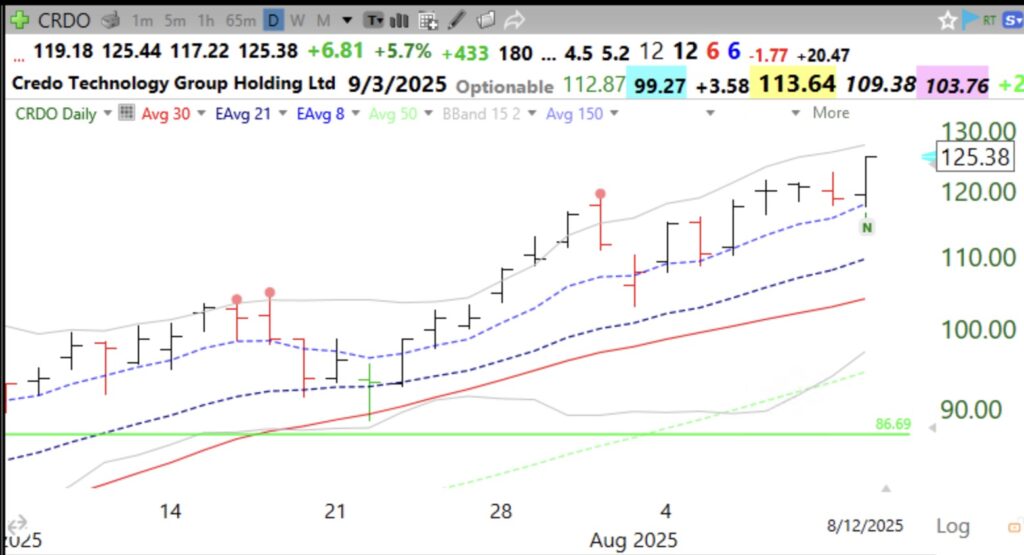
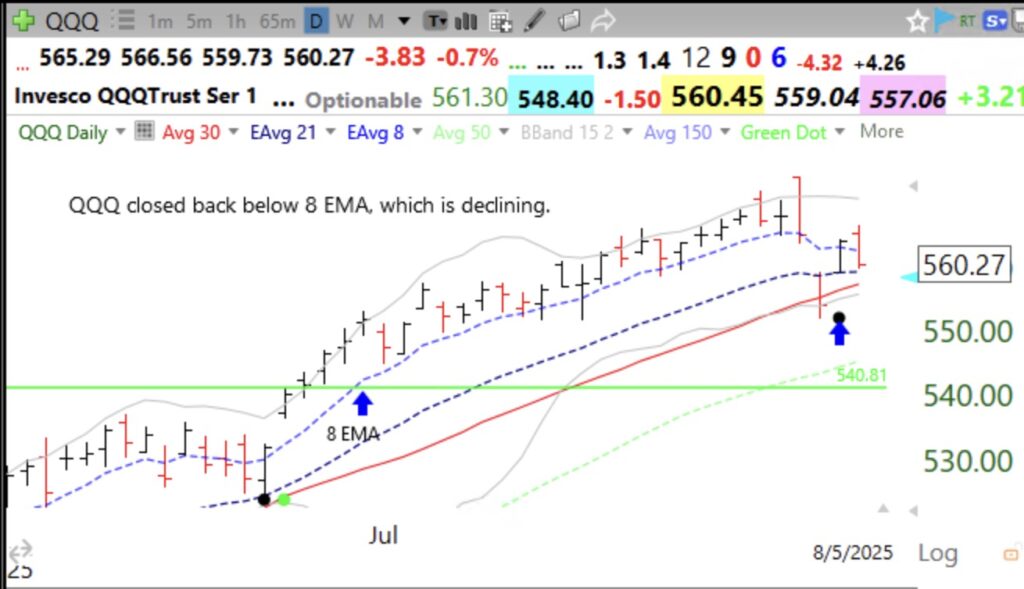
If I bought one of these I would sell with a close below the 8 EMA.They are sorted by earnings date. I explained this setup during my recent TraderLion appearance.
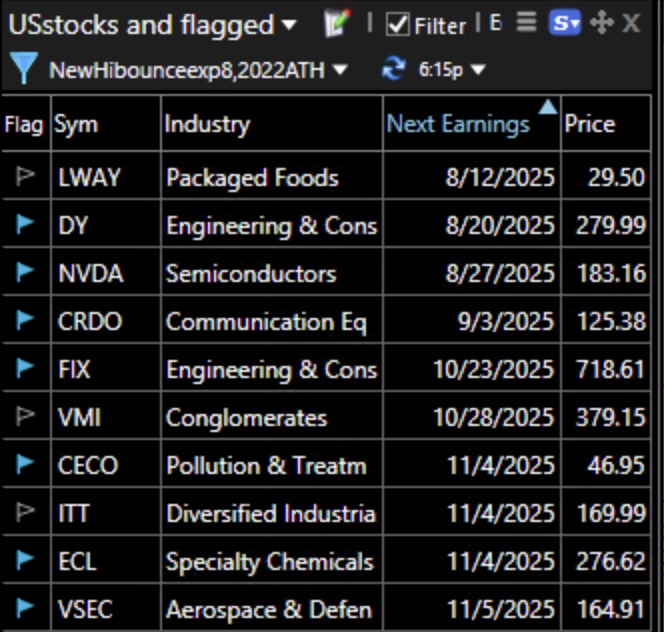
CRDO is a fine example of this setup. It is above the last green line and has been tracking its 8 EMA. IBD Comp=99 with estimated earnings up tripe digits. It has already advanced more than 4x from last year.