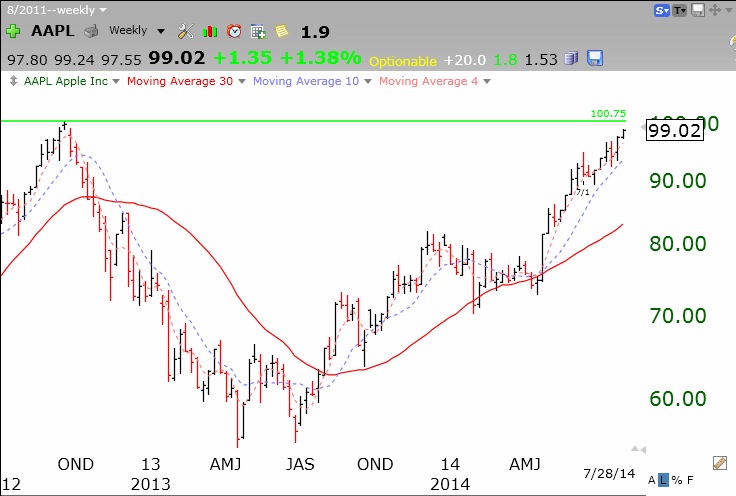
AAPL approaching all-time high—green line break-out! Check out this weekly chart.
Stock Market Technical Indicators & Analysis
AAPL approaching all-time high—green line break-out! Check out this weekly chart.
The short term up-trend in the QQQ that, according to my definition (proprietary, so don’t ask for it), began on May 13 has now extended to 52 trading days. While two of the up-trends since 2006 have lasted 80 and 88 days, of the 11 up-trends that lasted 50 to 88 days, 45% ended by day 54. So we are in nosebleed territory at day 52. On the other hand, I am talking only about short term QQQ up-trends. A short term up-trend could end, pause and then begin anew. The prior short term down-trend lasted just just 4 days. Remember also that the GMI, my longer term trend indicator, has remained on a Buy signal since April 22. So I remain very cautious, having taken profits on most of my positions in my trading accounts. My conservative university pension remains fully invested in mutual funds….
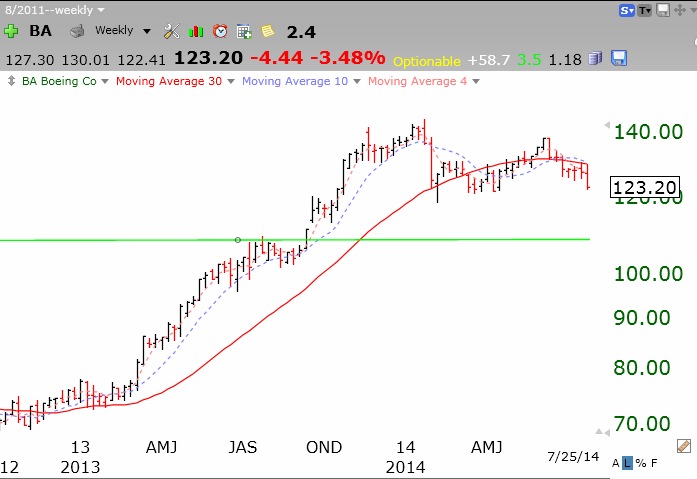
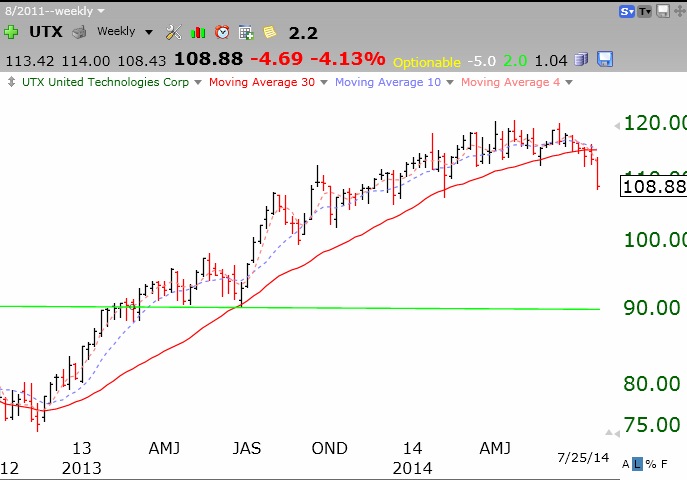
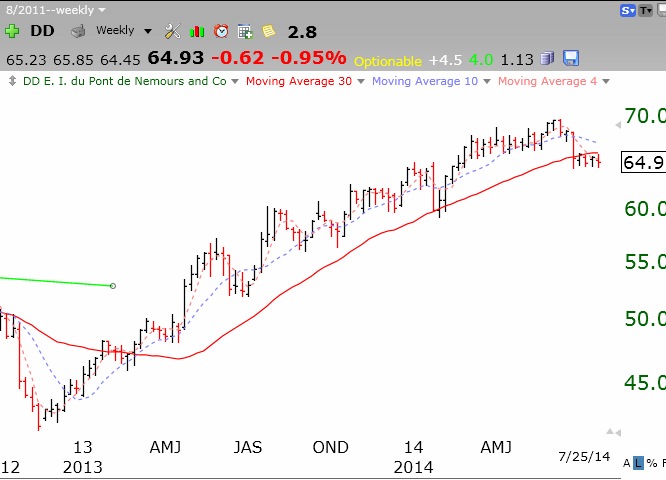
What makes me very concerned about this market is the large number of DOW 30 stocks, 9 0r 30%, that have now closed below their critical 30 week moving averages. According to Weinstein Stage Analysis, one should be invested in stocks when they are in Stage II, above a rising 30 week moving average. I never hold a stock that closes below its 30 week average. The following DOW stocks have now closed below their 30 week averages, after having been in Stage II advances for many months: BA,UTX,WMT,DD,PFE,GE,V,PG,MCD. These weekly charts show how weak BA, UTX and DD have become. The solid red line is the 30 week average. Click on charts to enlarge.
 Even GE seems to be faltering, with the 2014 advance stopping short of its 3013 peak.

When major industrial stocks like these appear to be weakening, can the rest of the market be far behind?
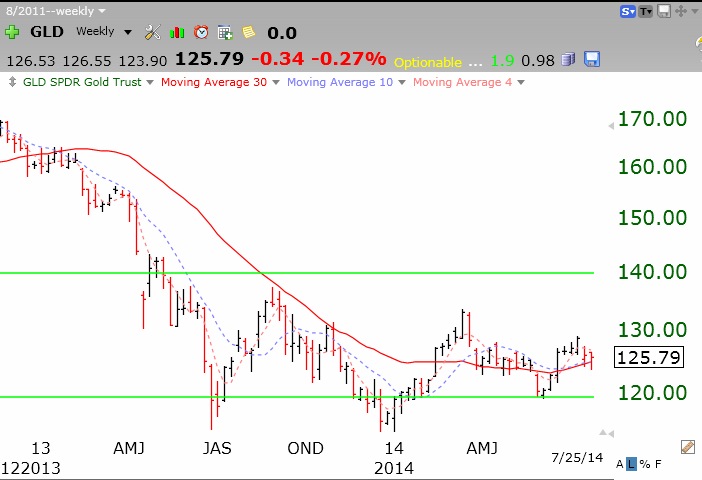
And gold may be in the final stages of a bottom, Stage I, as this weekly chart of GLD shows.
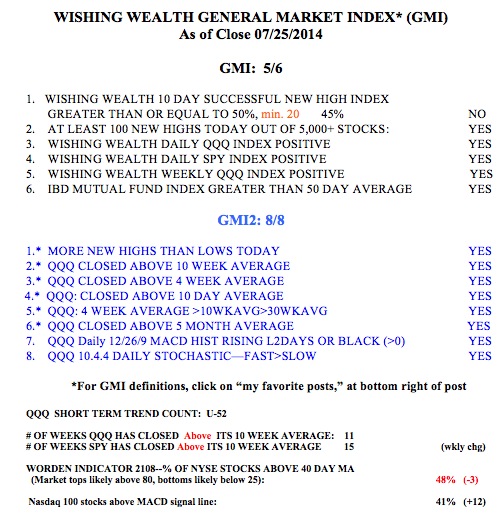
Meanwhile, the GMI remains at 5 (of 6). It is noteworthy, that its one negative component, is the one that measures whether stocks that hit a new 52 week high 10 days ago have continued to trade higher. It is ominous when stocks hitting new highs cannot continue to climb. If this market starts to crack, it should show up in my GMI-2 first, which contains a few very short term indicators.