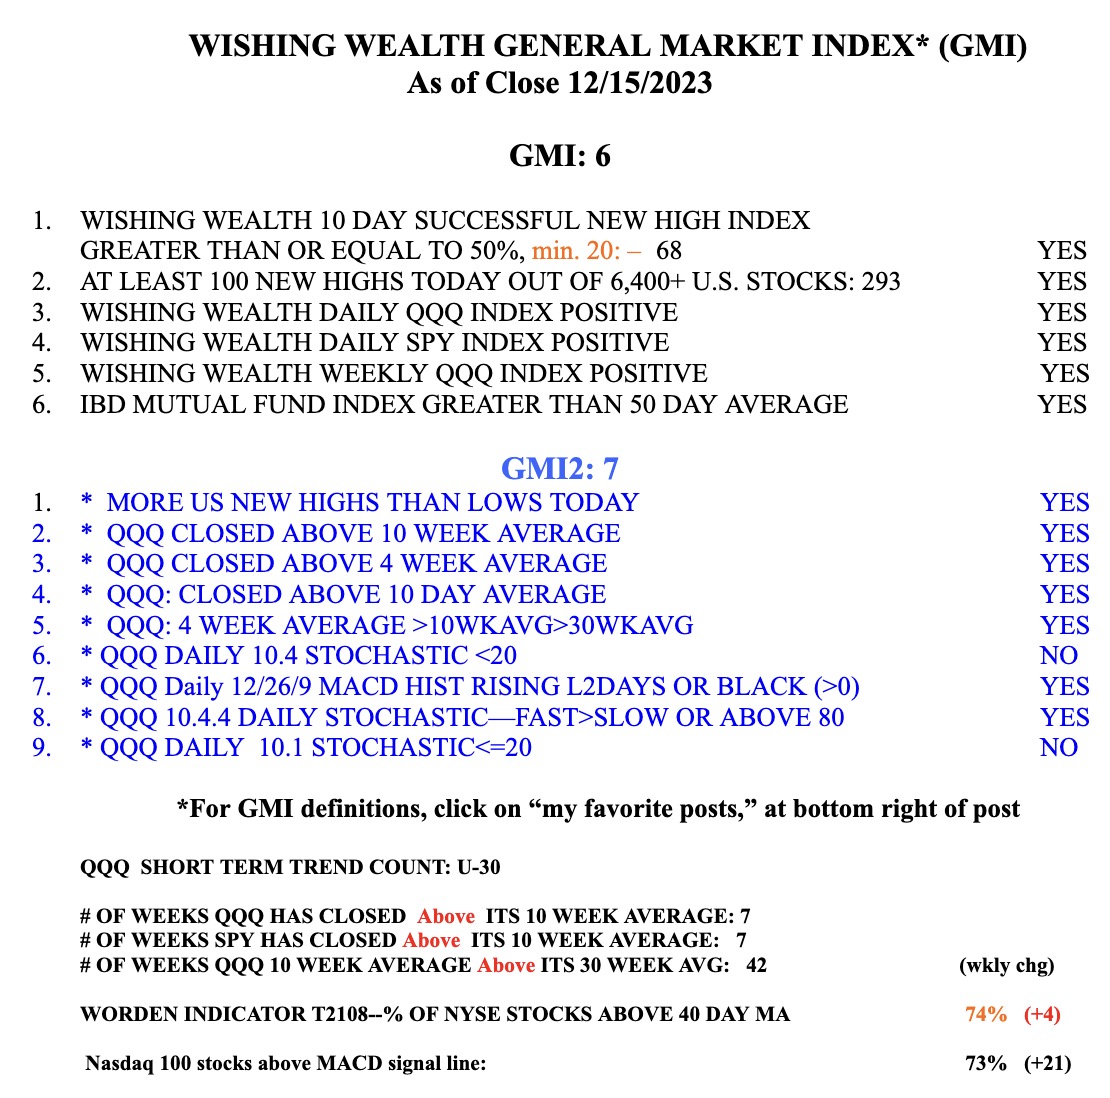
The GMI is Green and at 6 (of 6). We are entering the end of the 4th quarter when mutual funds buy up the strongest stocks so their quarterly reports make them look good.
Stock Market Technical Indicators & Analysis
The GMI is Green and at 6 (of 6). We are entering the end of the 4th quarter when mutual funds buy up the strongest stocks so their quarterly reports make them look good.
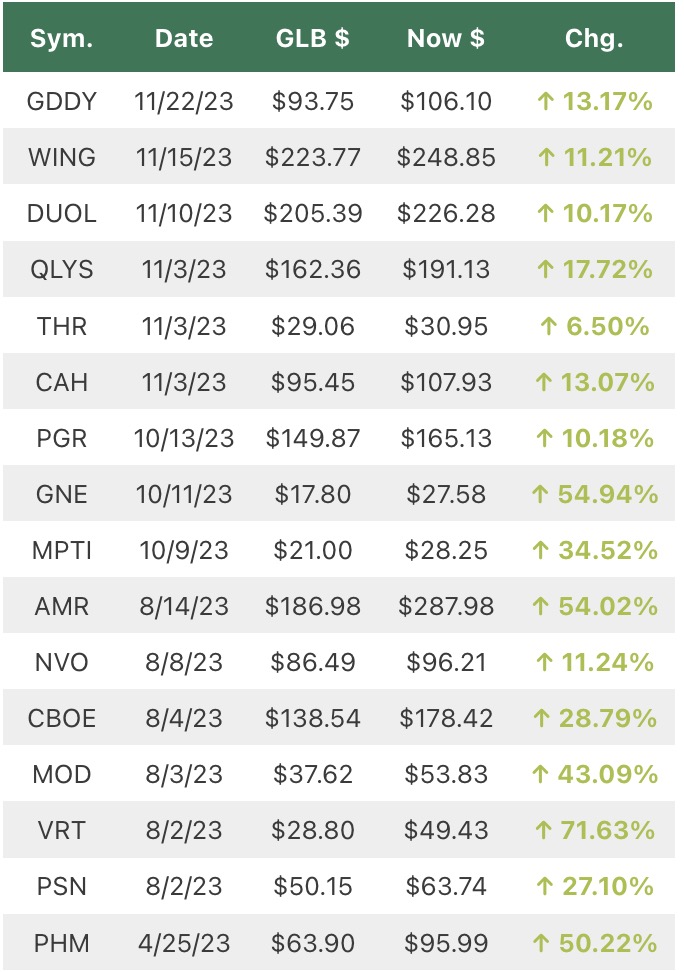
All GLBs (green line break-outs) are not successful. If I buy one when it occurs, I sell if it closes back below its green line. Most of the trading gurus I respect made their best gains with stocks going to a series of all-time highs. Use the box below to sign up to receive my blog each time I publish.