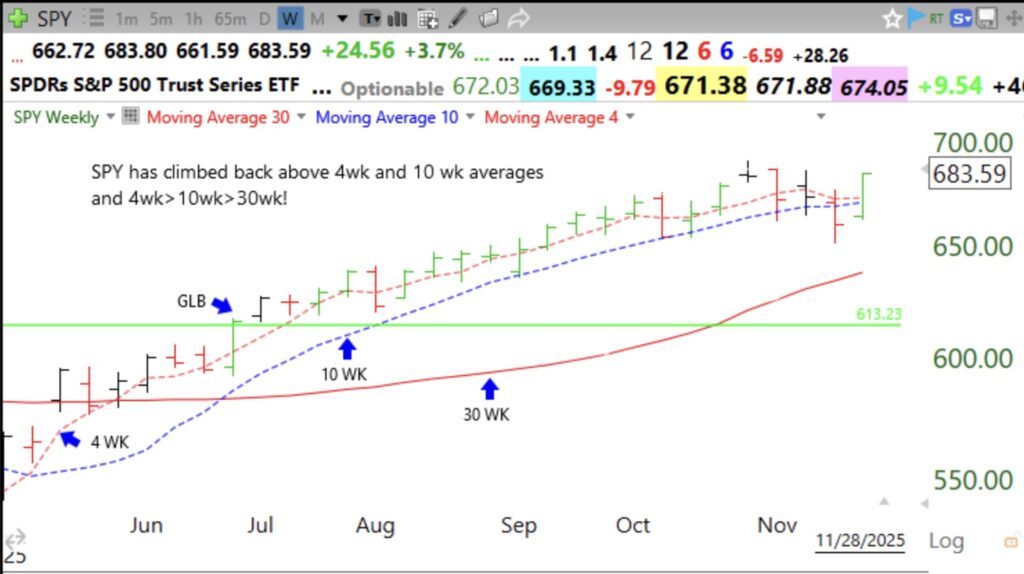
All averages are lined up on this weekly chart. Same as DIA and QQQ.
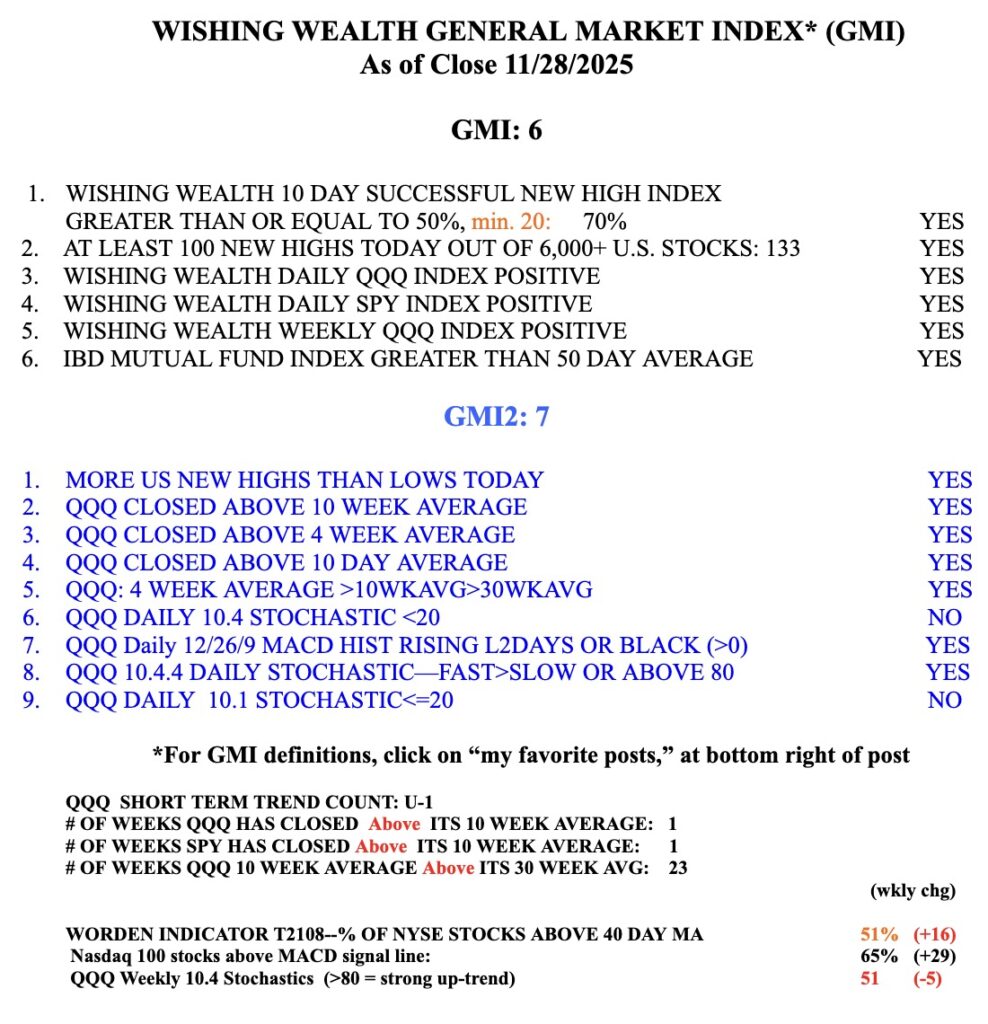
GMI=6 and GREEN!
Stock Market Technical Indicators & Analysis
All averages are lined up on this weekly chart. Same as DIA and QQQ.
GMI=6 and GREEN!
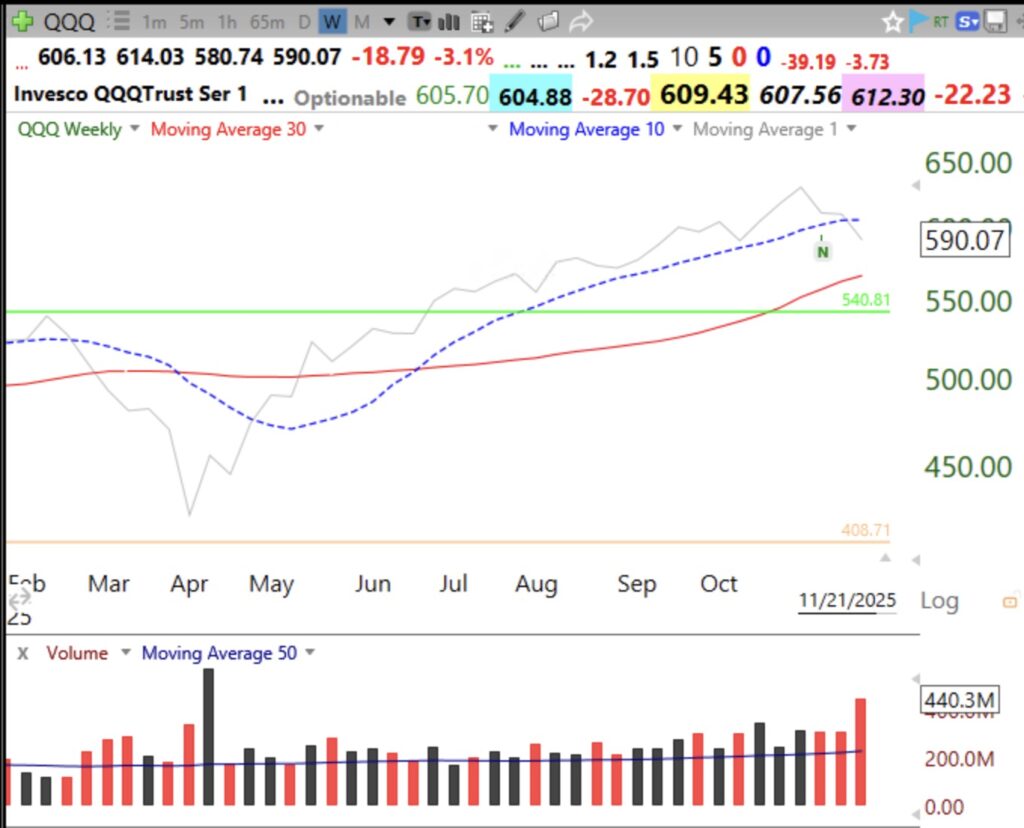
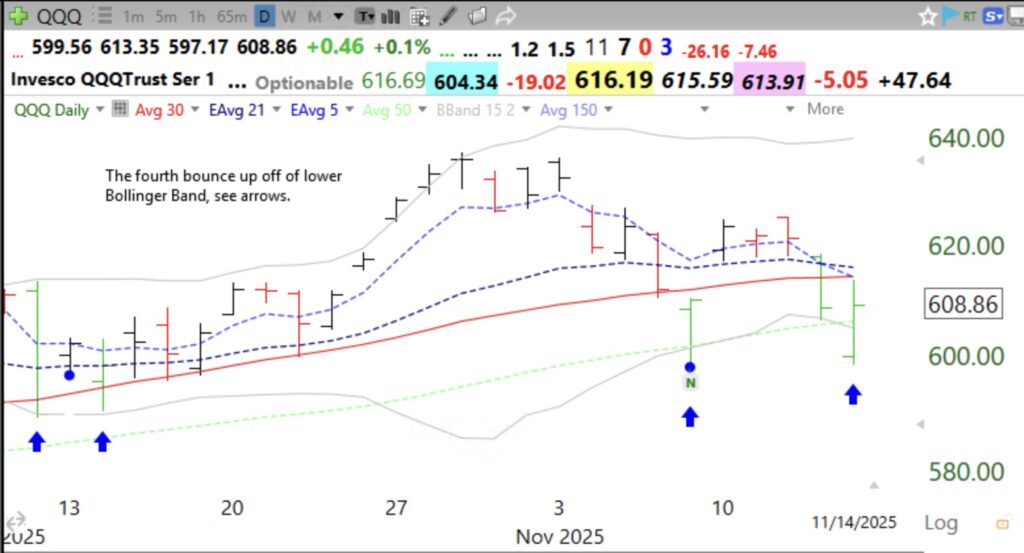
This weekly 10:30 chart of QQQ shows it to have closed (gray line) below its 10 week average (dotted line) on above average trading volume. Compare this pattern to the decline last March and April. The question remains whether QQQ will retake this average or decline to the 30 week average (red solid line) or to the prior green line. A close below the 30 week average and if the red line turns down would give me a major Stage 4 sell signal and the likely beginning of a major decline. Since 2000 this signal got me out early from all major declines. For now, I prefer to be mainly in cash with a little SQQQ in my trading accounts. I only go to cash in my university retirement accounts when the markets are in a Stage 4 decline.
The GMI is 1 (of 6) and on a RED signal.
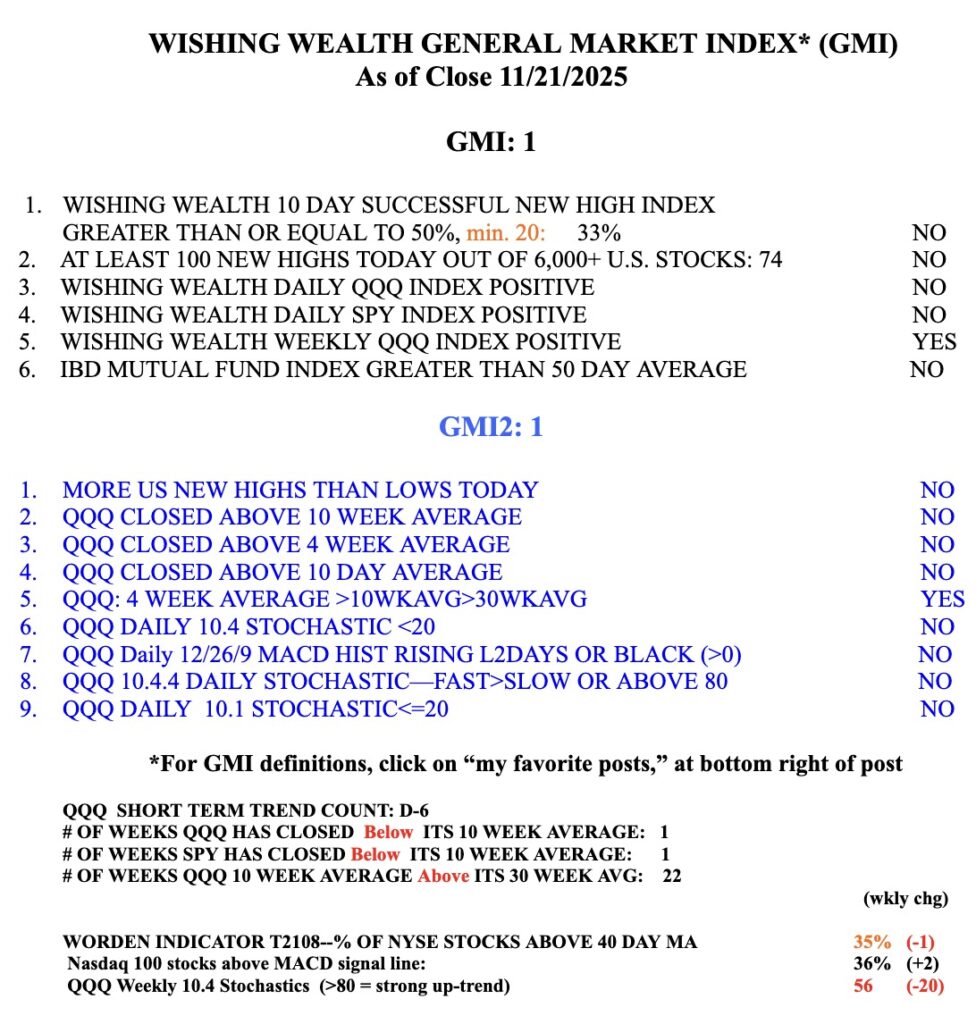
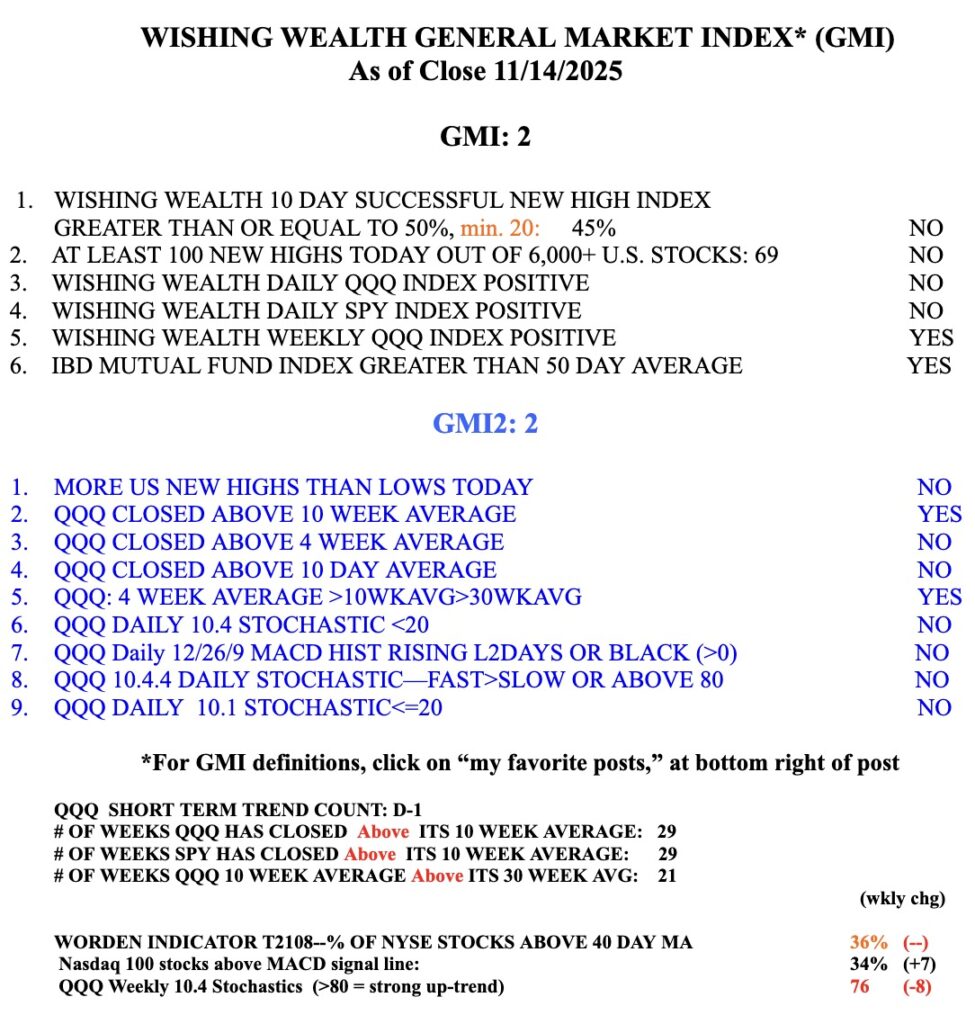
The GMI=2 and could flash RED on Monday.