The decision to buy a stock is relatively easy, and by setting an immediate stop, I have a good chance of being sold out of a position with a small loss if the stock I buy thinking it will rise, goes down quickly. A major problem, however, is knowing when to sell a stock that has advanced and shows a profit. Too many times I get shaken out of a stock because of a technical signal or more often because the entire market shows short term weakness, only to see my stock advance without me. When I later analyze my decisions, I see that I had panicked unnecessarily (I am a chicken!). I end up having small losses but I miss some large gains. In a long up-trending market like the present, this scenario has occurred often. (The maxim, cut your losses and let your profits run, is easier said than done.)
I have therefore been focusing on designing a better method to keep me in rising stocks. I had experimented with using weekly charts in a yellowband up-trend but find that the technical signal to sell, closing below the 10 week average, could lose me a lot of the profit. I therefore have returned to using a daily RWB chart of 13 daily exponential moving averages to inform both my buy and sell decisions. I think this method is more effective.
First, you may want to review my post on the construction of daily RWB charts from December 10. A rising stock will close above all 12 daily averages almost every day (the 13th average of 1, a dotted line, is the daily close). I would like to buy promising stocks in a strong RWB up-trend that have rested and look like they are about to resume their advance. Thus, I am looking for a stock that closed recently below all of its red lines (the 6 shorter term daily averages) and has now closed back above all 6 of them. I have designed a new TC2000 scan, described below, that identifies such stocks that I am making available in my TC2000 club, Dr. Wish.
If I buy such a stock, I want it to subsequently keep closing above its red lines, leading them higher. This is shown on the chart by the dotted line rising above all of the red lines. If the stock closes soon back below all of the red lines, I exit immediately. If it goes on to rise for a long time, I hold until it to closes below all of the red lines. I say close, because many stocks trade below all of the red lines intraday only to find support and close back above them. I also think it would be safer to wait for 2 consecutive closes below the red lines to sell a position that has a large profit.
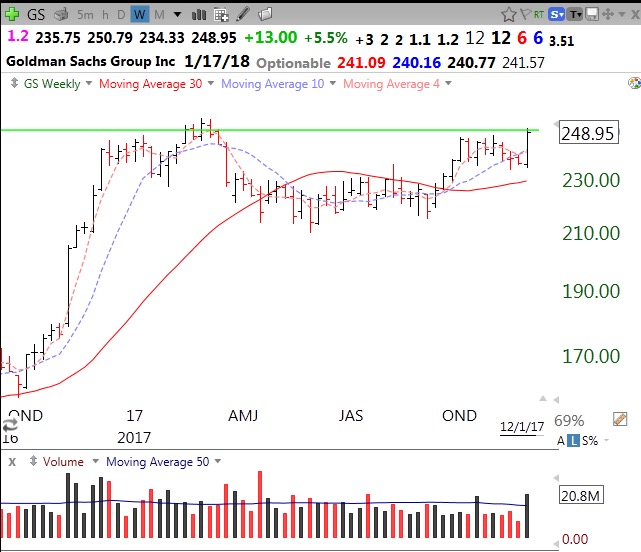
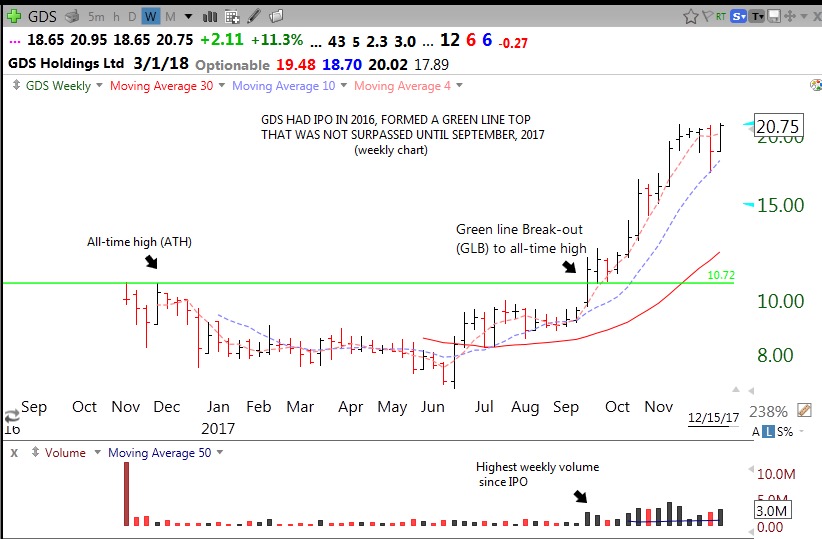
Since a chart is worth a 1,000 words, let’s look at one of the stocks, GDS, which came up on my new scan this weekend. This weekly chart shows that GDS had a green line break-out (GLB) to an all-time high (ATH) in September, 2016. I like the fact that it is a recent IPO that rested for 10 months after forming a top. The GLB came on the highest weekly volume since the IPO.
So how could one use the daily RWB strategy to trade GDS at the GLB and currently? This daily RWB chart shows that at the time of the GLB, GDS was beginning a RWB pattern and had now closed above all of it rising red lines. Since the break-out, GDS has mainly closed above all of the red lines and only closed below all of them for the first time 3 months later in early December, after almost doubling. This is the pattern of a stock in a consistent strong up-trend. According to the RWB daily strategy, the only time for selling would have occurred when GDS closed one or two days below all of its red lines, in December. After this drop occurred, all of the red lines converged, showing lower movement and/or volatility in its closes. When the red lines converge, it is time to step back and wait for a break-out up or down–one has to wait for the move and not try to anticipate which direction the stock will go. (React, do not anticipate–by guessing in advance one will be wrong often.)
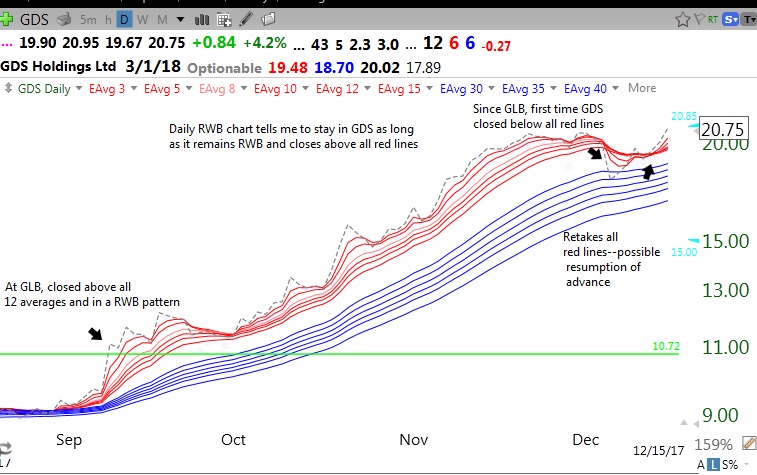
The reason GDS came up in this weekend’s scan is because the scan identifies strong stocks that recently closed below all of its red lines, has retaken them and is now in a RWB up-trend. As an example, if I were to buy GDS on Monday, I would then wait to see if it holds above the 6 red lines and continues up. If it fails the red lines quickly, I would exit with a very small loss. The red number at the top of my chart, after the word “optionable,” shows the current value of the lowest red line, currently= 19.48. So if towards the end of the day or so after purchase, it looks like GDS will close below 19.48, I would exit with, I hope, a small loss.
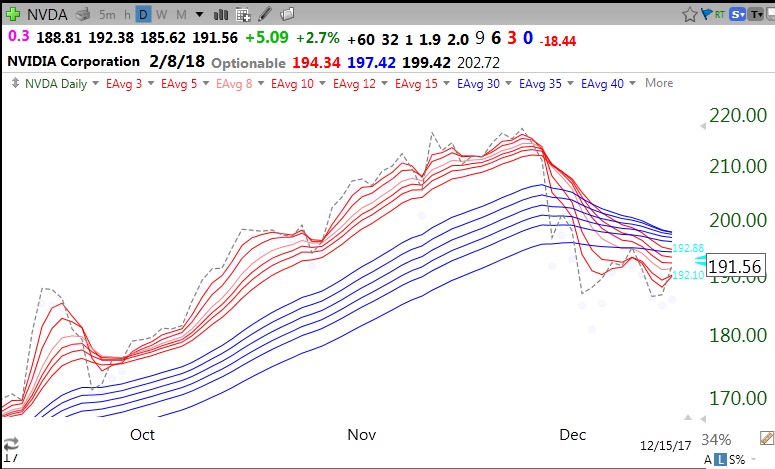
As an example, look at how this RWB daily strategy might have helped one exit the leader, NVDA, at the right time at the end of November. We will have to wait to see if this is the end of NVDA’s bull market run or just a pit stop. I might get interested when/if NVDA retakes all of its red lines and is forming a new RWB pattern again. I can set an alert in TC2000 to text me during the day when this technical signal occurs with a specific stock.
I noted that I had run a scan this weekend to find candidates showing a RWB bounce. These stocks have good technicals, have advanced a lot this year, and might be worth researching. The scan yielded 13 out of about 4900 stocks that met my scan’s criteria. The stocks are listed below, in descending order of their most recent quarterly earnings percent change. GDS has no EPS comparison yet and is at the bottom of this list.
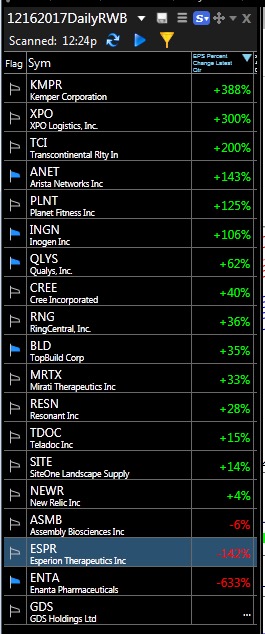
All of these stocks are not trading above their last green line tops and would not be of interest to me. I always look at a stock’s monthly multi-year chart to see if the stock is near its all-time high, a major criterion for me. In this list the following stocks are not above their last green line tops: CREE, MRTX, RESN, ASMB and ESPR. They may continue to advance, but they also may have to get through much over-head supply from the selling of people who bought them at higher prices.
For those of you who have a TC2000 account, you may access this new free scan (12162017DailyRWBBounce) at my club by clicking here or on the bar at the top of this blog, “TC2000 Scans and Watchlists“. The scan criteria are specified in the glossary page for this blog. I would be interested in hearing whether this scan helps your trading. By the way, I scanned a combined watchlist that contained more than just US stocks (N=4907). You will have to create such a list yourself. The scan posted in my club uses only the US stocks list provided in TC2000 (N=4817). GDS is a company based in China and therefore does not come up in the scan of US stocks I published in my club.
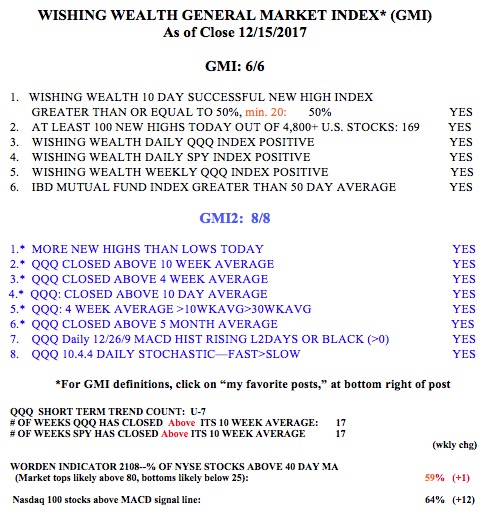
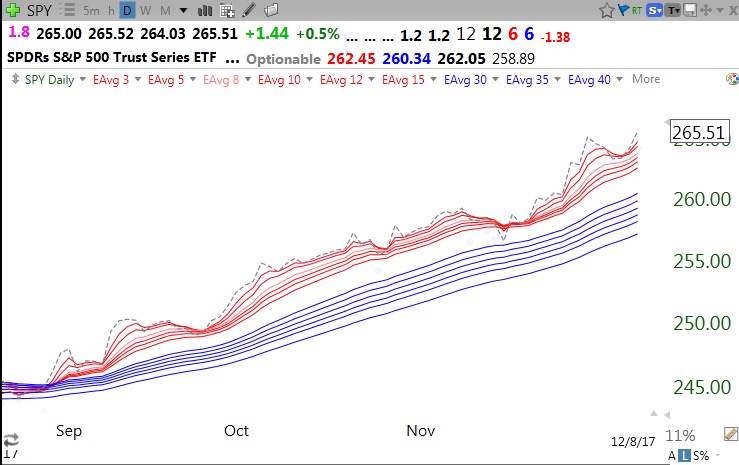
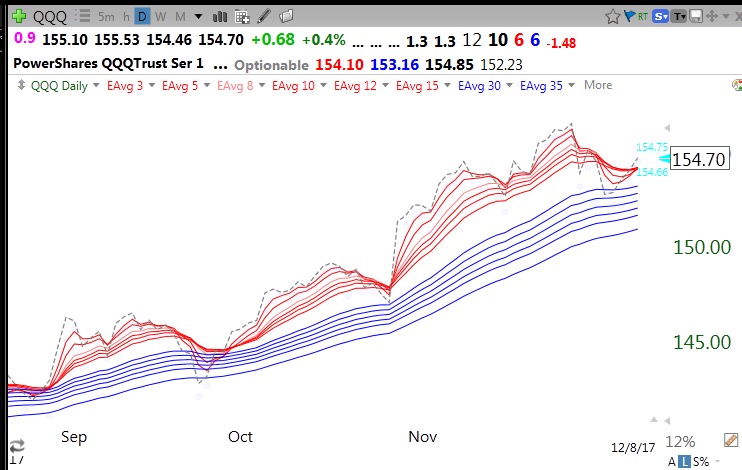
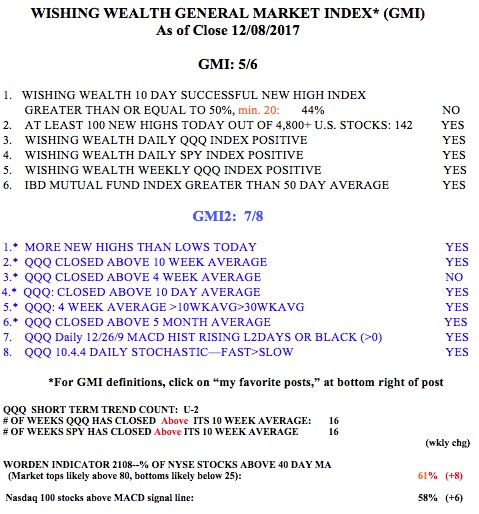
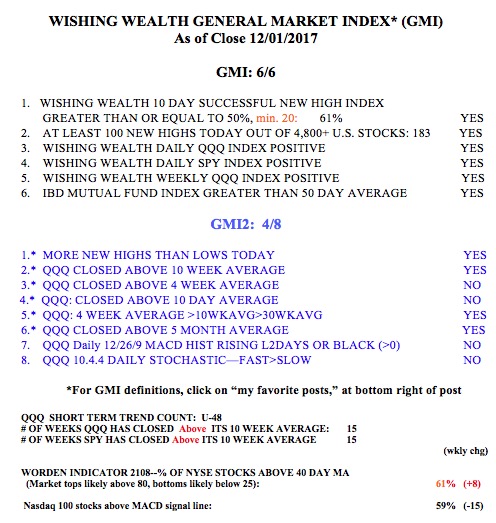
Meanwhile, the general market indexes (QQQ,SPY,DIA) are in RWB up-trends and the GMI remains at 6 (of 6).