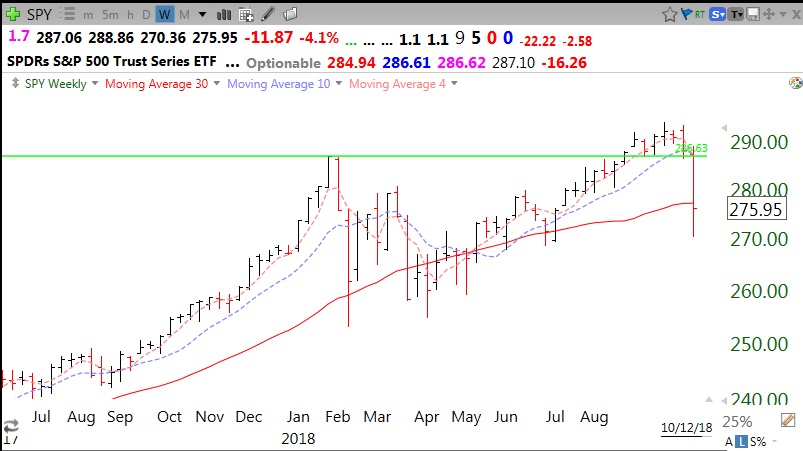
No one knows if the oversold conditions reached on Thursday and Friday are the final lows for this decline. T2108 did briefly reach single digits and the put/call ratio did reach 1.2, indicating very oversold daily conditions. The daily stochastic did fall below 20 and a green dot crossover occurred on Friday. The Friday bounce may therefore have further to go. An ominous sign of weakness is that the recent GLBs of the DIA and SPY have failed–they both closed back below their green line tops.
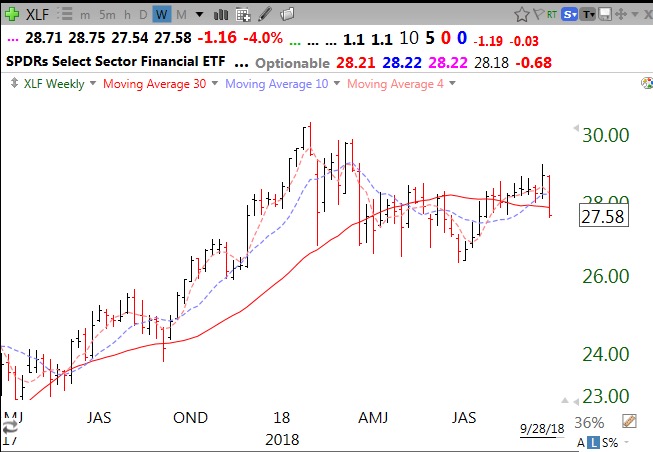
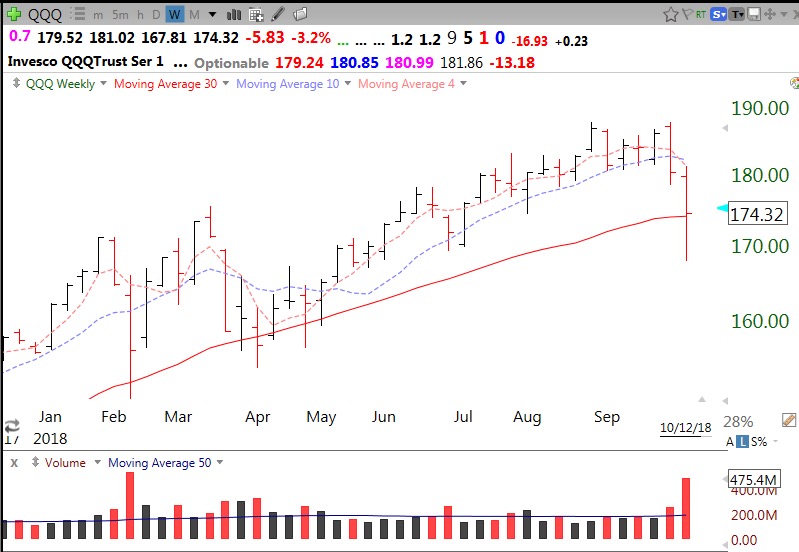
There are a number of factors which I will monitor to determine when it is really safer for me to go long again. Perhaps the most important is the weekly chart of the QQQ (below). The QQQ closed right above its 30 week average (red line). The last time the QQQ closed the week below this critical average was last April–for one week. It then retested the average on three separate weeks. A close below the 30 week average is a sign of significant technical weakness for me and if the average turns down it could signal the beginning of a Stage IV decline. Also note that in a sustained up-trend the 4 week average (red dotted line) remains above the 10 week average (blue dotted line) which in turn is above its 30 week average. This pattern was evident from May until 2 weeks ago. I have written before that I have more chance of profiting on the long side buying growth stocks when the QQQ closes above its 10 week average. It is possible to trade long for a considerable period when the QQQ has the 4w>10wk>30 wk pattern. Currently, the 4 week average is heading down and is actually below the 10 week average. My preferred buy signal will happen when that pattern comes back. For now, I am content to remain on the sidelines while the bulls and bears battle it out. (In reading this chart, remember that the QQQ might trade below an average intraweek and that the closes in the chart represent the weekly close.) A trend follower acts after the technical signal has occurred, not before.
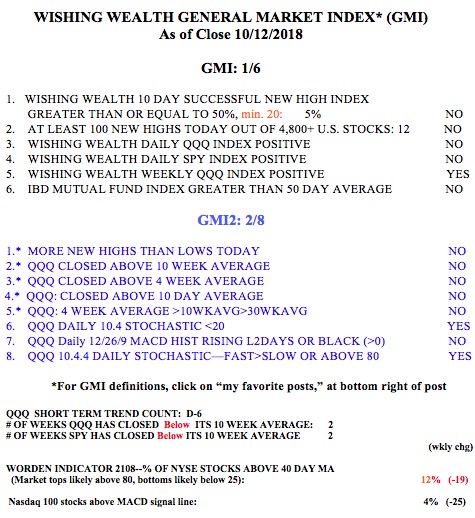
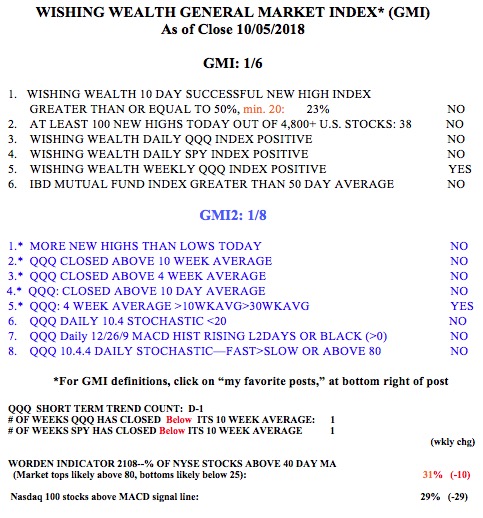
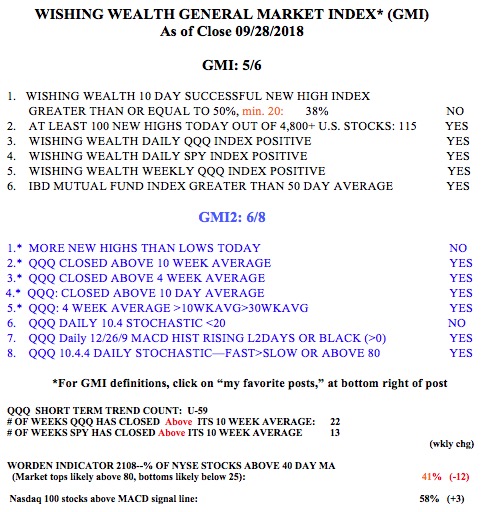
The GMI= 1, of 6, and remains on a Red signal.