Last week I had the first meeting of my class of 120 freshmen who are enrolled in my 14 week semester long course on the stock market. Since many of them will be looking at this blog for the first time, I am focusing today on helping first time users. Here is a set-up I may use for purchasing a stock. I first make sure that the market trend is up. As long as the GMI is Green I feel that the odds are in favor of owning stocks. I then wait for a stock on my watchlist to show a good set-up. Biotech stocks have been very strong lately because of buy-outs (KITE) and exciting clinical trials. A number of them are also presenting results at conferences this month. A good presentation can propel a stock higher. Biotech stocks are very speculative though because they usually have no earnings and a failed trial or sudden death of a patient in a clinical trial can cause a stock to tank. So one would only invest a small portion of their capital in a biotech stock.
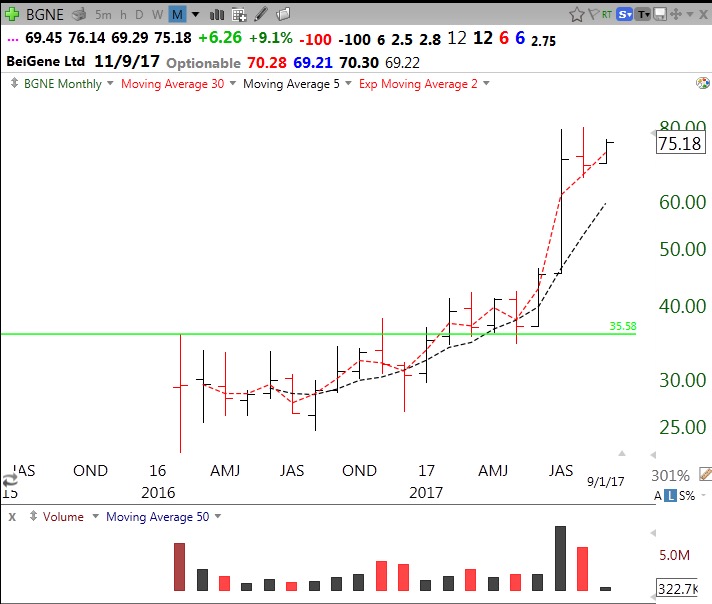
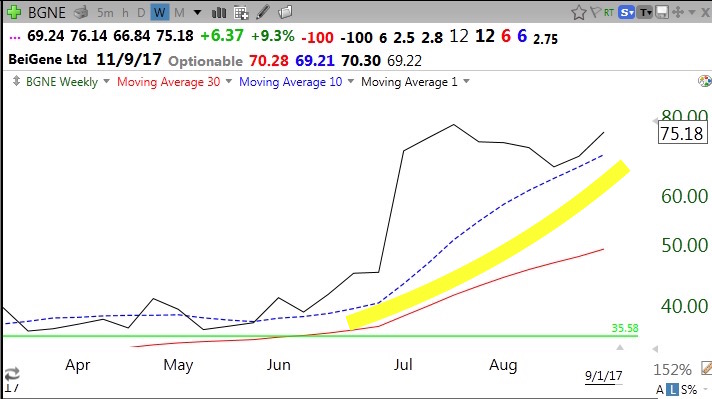
With that caveat, BGNE was on my watch list and showed some good technical qualities. First, a monthly chart shows that BGNE is above its last green line top. (A green line is drawn on a monthly chart at the highest monthly price that has not been exceeded for at least three months or bars). In February, 2017, BGNE broke above its green line top (GLB= green line break-out) and then went sideways for several months. In July, BGNE took off on very high volume when it announced a partnership with Celgene. Note that BGNE came public in 2016. New stocks (IPO) that form a base and then make an all-time high (GLB) are often great candidates for purchase. Also, note that my chart shows that next earnings are expected on 11/9/17 and so there will be no imminent earnings release to affect the stock.
Next I look at the weekly chart. I want the stock to be in a yellowband up-trend. That means that the stock is consistently closing above its 10 week average (blue dotted line) which is rising above its 30 week average (red line). If I can draw a yellow band in the space between the rising 10 and 30 week averages, that stock meets my criteria for a rising “yellowband” stock.
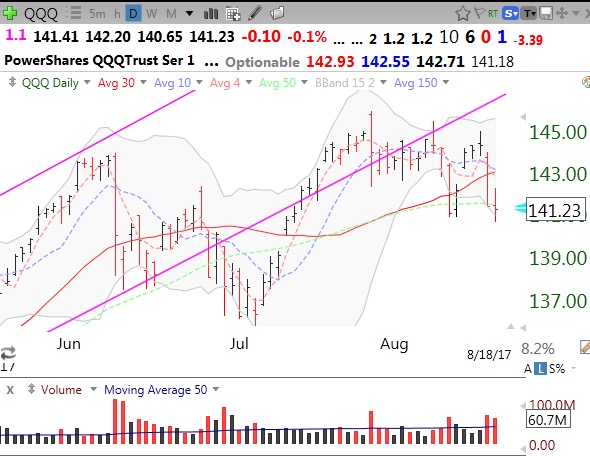
Now, the key is to buy such a stock using a set-up, which if it fails, leaves me with a relatively small loss. One never knows which stock one purchases will fail, so it is critical to plan an exit strategy in advance of purchase. One must have a specific technical price/condition that indicates that the trade has failed. For timing the entry, I usually look at the daily chart. There are a number of set-ups I look for to time entry. One of them is a bounce up off of the 30 or 50 day moving average. BGNE last Friday bounced up off of its 30 day average (red line). The prior day it bounced off of its 50 day average (green dotted line). If I bought BGNE because of the 30 day bounce I would exit if the stock comes back below the low of the bounce of the 30 day average (69.29). I might even sell earlier if BGNE traded back below its 30 day average (71.15), yielding a smaller loss. The key is to sell out quickly if a stock does not act as predicted when one purchased it.
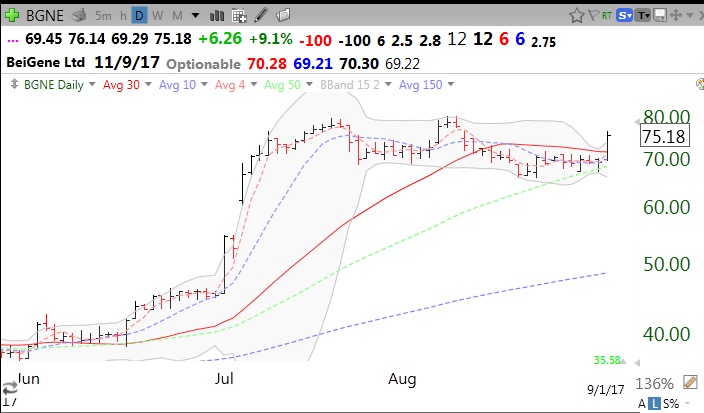
Given BGNE’s multi-month yellowband pattern, if the stock rises for a while, I might sell out only if the stock closes back below its 10 week average on the weekly chart. Big money is possible in holding a yellowband stock as long as the pattern holds. By focusing on daily gyrations, one is often shaken out of a solid yellowband stock. So before selling I first check out the weekly chart. I often tweet my set-ups intraday as they occur: @wishingwealth
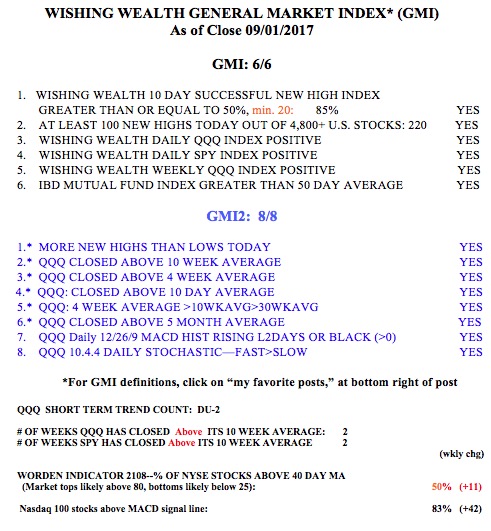
The GMI is back to 6 (of 6) and Green.