Most of the stock gurus whom I respect have written that one can make the most money by investing in companies that have visionary, often revolutionary products. When Nicolas Darvas made millions in the 1950s he invested in rockets, as the country became involved in a race to space. Other more recent examples are the PC revolution, the internet, and now Elon Musk’s foray into electric cars, solar energy and commercial space travel. Today we are in the middle of a huge revolution in biotechnology as scientists begin to use their understanding of the human genome to make new drugs and medical treatments never thought possible. There is a revolution occurring in the biotechnology sector and astute investors who own these firms will be well rewarded when a new drug or breakthrough treatment is announced.
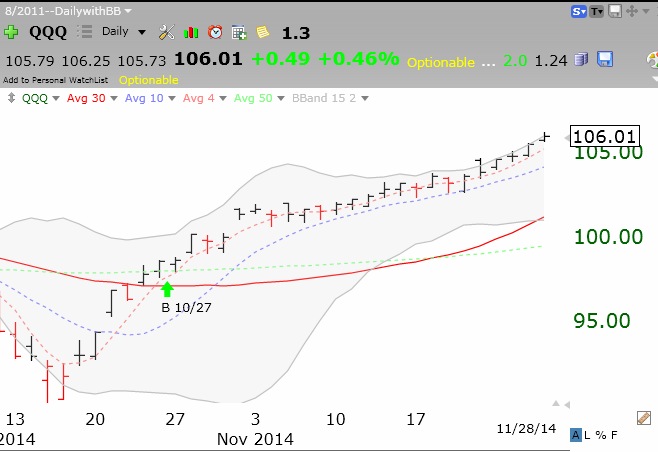
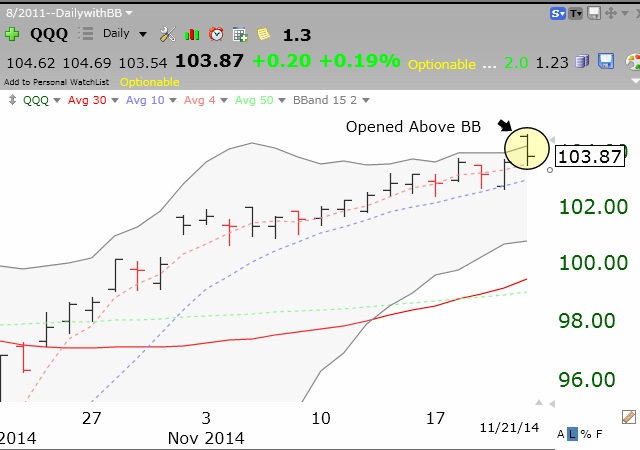
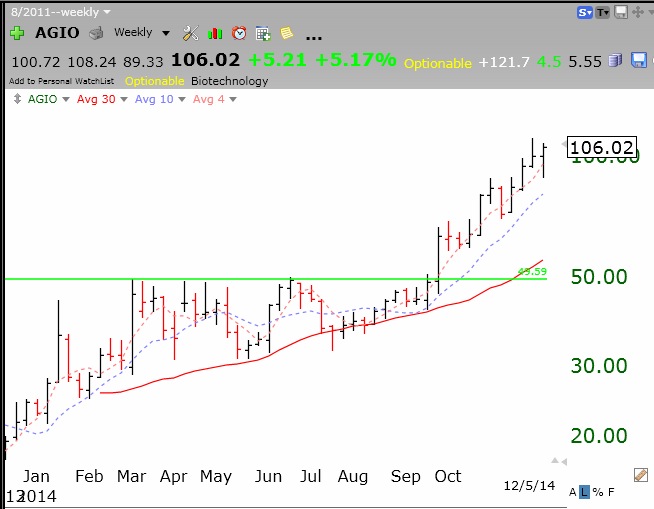
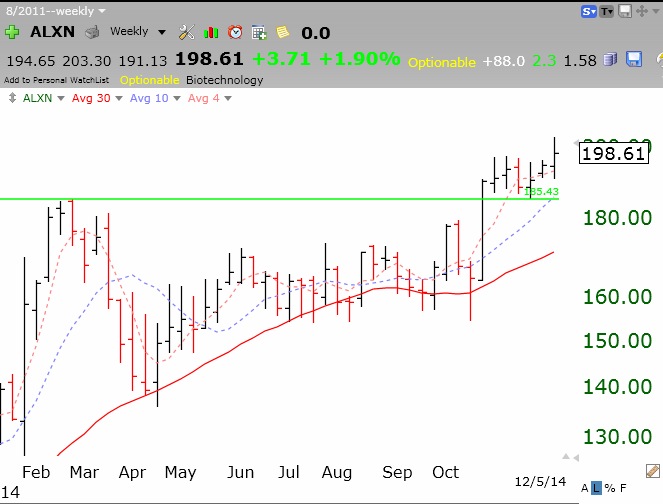
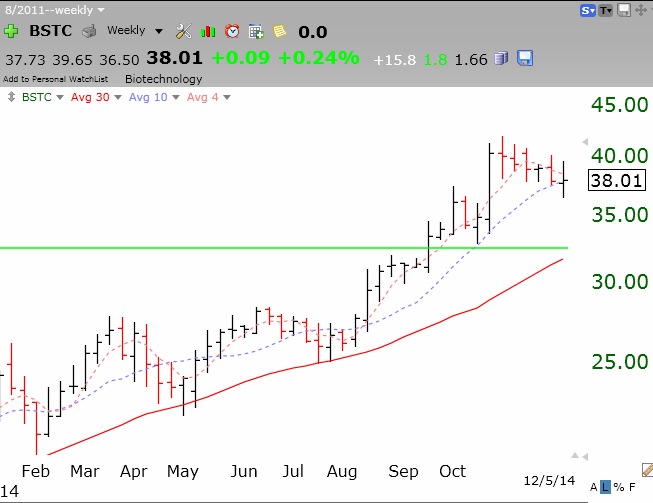
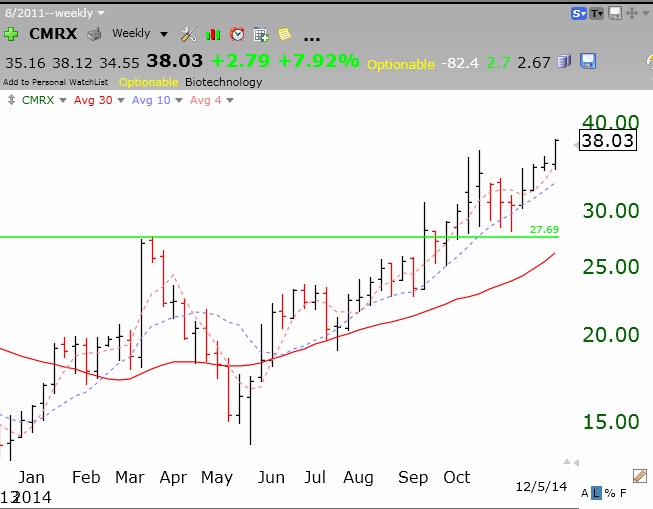
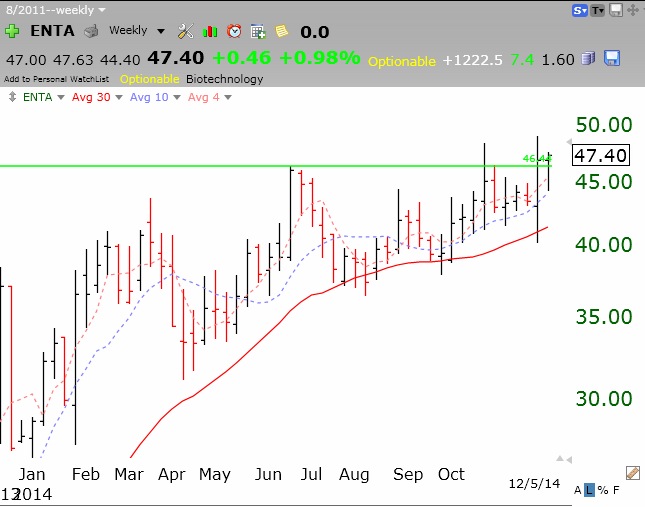
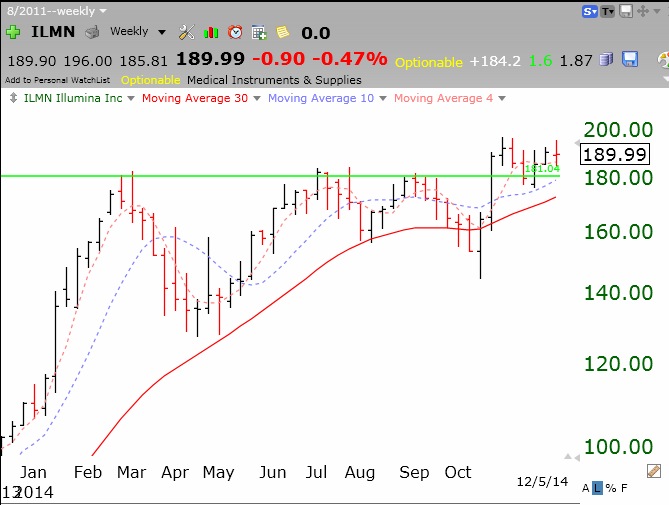
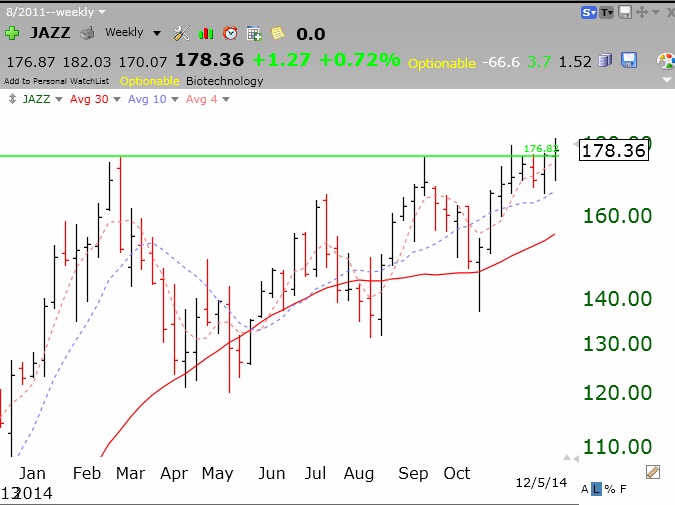
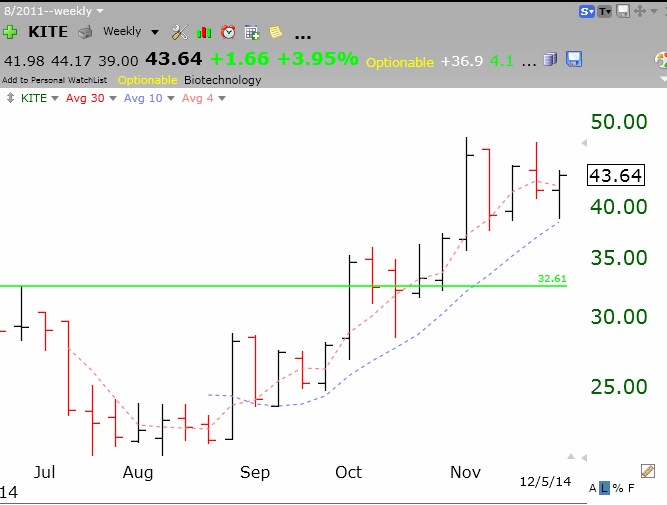
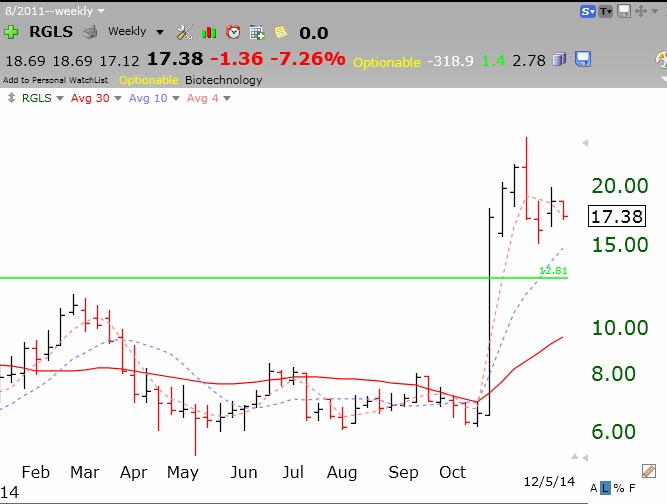
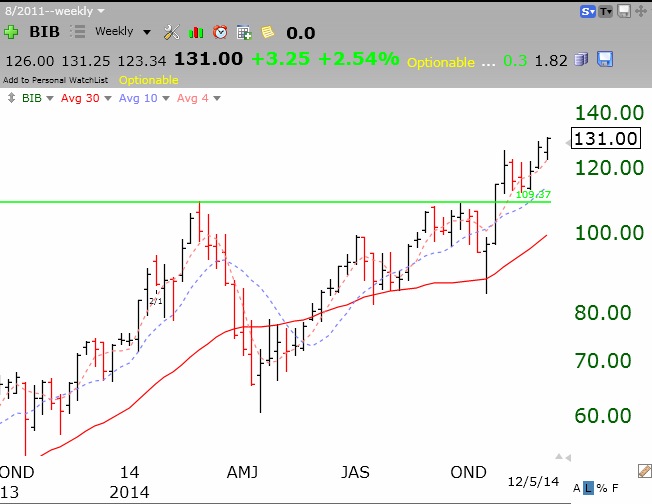
A major way that I have developed to alert me to promising new stocks that are being heavily accumulated is my green line technique. On a stock’s monthly chart I draw a green line at the highest price the stock has ever reached and has not surpassed for at least 3 months. The green line signifies the top of a base or consolidation period at which the stock has rested for a few months. When a stock pushes through its green line top, especially on unusually high trading volume, I take notice.
I have put together a list of 9 biotech stocks and one ETF that have recently passed their green line tops. These are stocks which I then research to assess the probable developments that are causing buyers to push them to all-time highs. Biotechs often do not have earnings. It is the possibility of future earnings to be derived from newly developed exciting products that ignite buyers’ imaginations. I just want to hitch a ride on a rocket. By the way, I own some of these stocks.
Their weekly charts, in alphabetical order:
 And one leveraged ETF…..
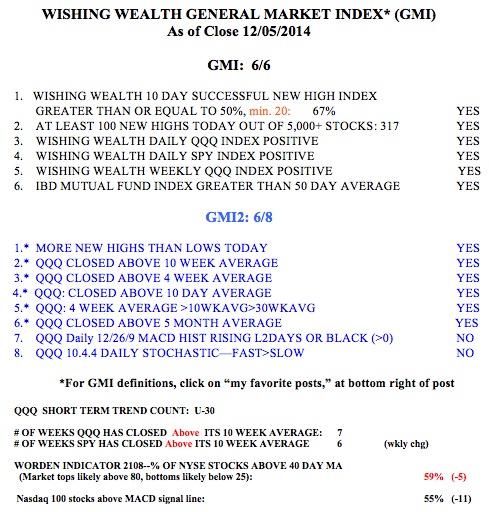
 The GMI remains at 6 (of 6):
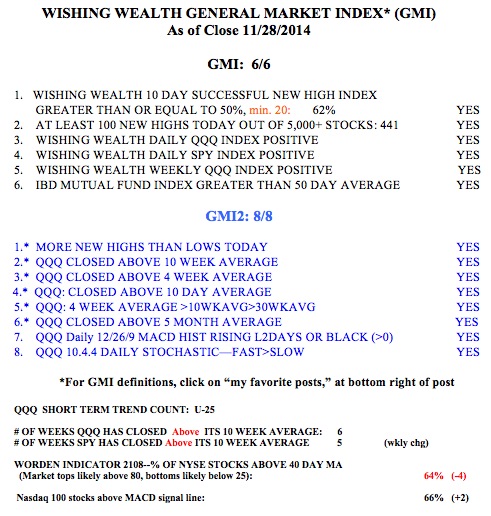