With the T2108 indicator at 82%, I remain invested long, but remain ever cautious. This weekly chart of the T2108 shows that this pendulum of the market does not tend to go much higher before it reverses, but it can stay high for a few weeks.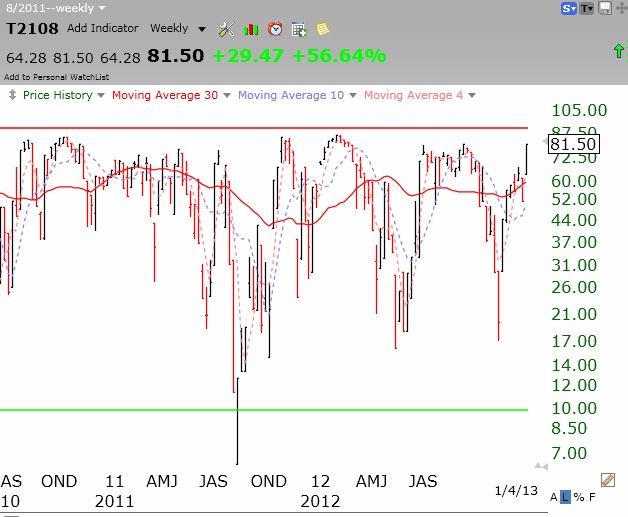 The red horizontal line is drawn at 90%, where a few rallies have managed to reach since 1986 when the indicator was made available by Worden. The last time the T2108 approached 90% was in 2009 during the rebound from the panic decline in 2008. At the depths of the 2008 decline, the T2108 had bottomed at 1.2%, a level not seen since the 1987 market debacle (at .5%). Given that the market is not coming back from a huge decline, the 80-85% level may be as far as this market will rally. I remember a lot of markets that topped out in January, and this is a year of potential weakness coming after a presidential election…….
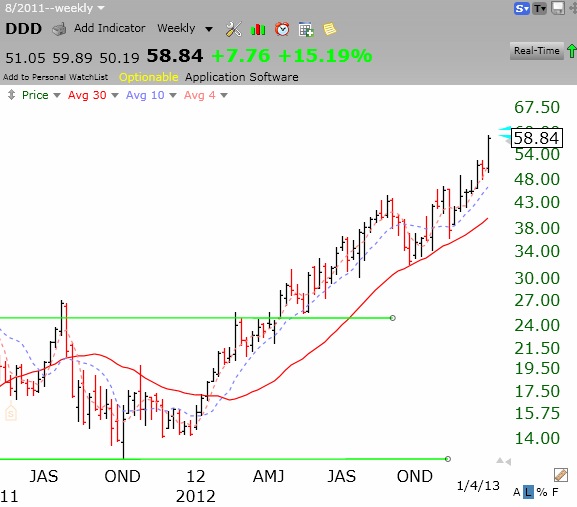
A long time ago Judy, my stock buddy and extraordinary concept stock picker, told me about the exciting 3D printing concept. She talked about DDD and SSYS. I posted about these companies last May. DDD was around $25 and SSYS around $47. DDD closed Friday at $58.84 and SSYS at $82.25. Both stocks have been gaining strength throughout the fiscal cliff hysteria. I think these companies still have potential and are worth researching. 3D printing is an exciting concept that many no little about. DDD has been high on the IBD50 list many times, showing the fallacy of the common assertion that stocks on that list are too late to buy. I own some DDD. Check out this weekly chart of DDD at an all-time high….
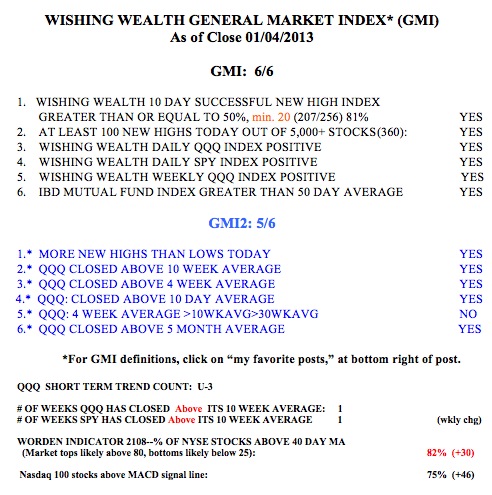
The GMI table is presented below. Both the SPY and QQQ have now closed above their critical 10 week averages.