I monitor an oversold indicator which counts 4 things. The reading is now 3 (of 4). I suspect we will get a bounce very soon. However, with the GMI at 1 (of 6) and on a Sell signal and with IBD saying the market is in a correction, it is not time for me to re-enter this market in my trading accounts. The market, however, remains in a Stage 2 Weinstein up-trend, so I am leaving my university funds in invested in mutual funds for now. If the GMI reaches 0, I will begin to take some of that money off of the table. In a prolonged bear market, the T2108 will reach 15% or lower and it is currently at a neutral 50%. But Friday’s put/call ratio was just over 1.0, a sign of a short term very oversold market ready to bounce.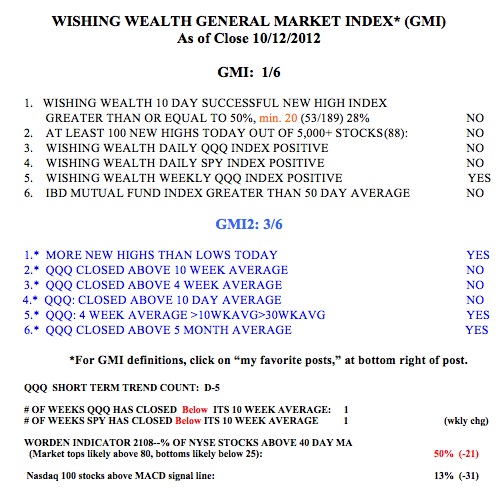
General Market Index (GMI) table
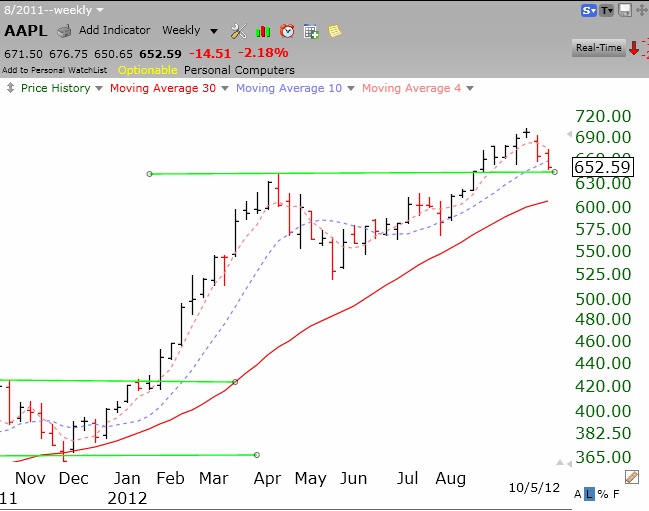
New QQQ short term up-trend again in jeopardy; AAPL the cause
The short term QQQ up-trend reached day 2 (U-2) on Friday but could turn down with a weak day on Monday. The QQQ reflects tech stocks and is heavily influenced by AAPL. For the first time since last June, AAPL has closed below its critical 10 week average (blue dotted line in chart below). I have found it profitable only to hold AAPL when it is above its 10 week average. I do not know if this weakness is just the pre-earnings release swoon or something more ominous. I have a small put position in AAPL for the coming week. It will be an especially negative sign for me if AAPL closes below its last green line top, around $644. Click on chart to enlarge. When the leader cannot push to new highs, it often is a sign of future weakness for the rest of the market.
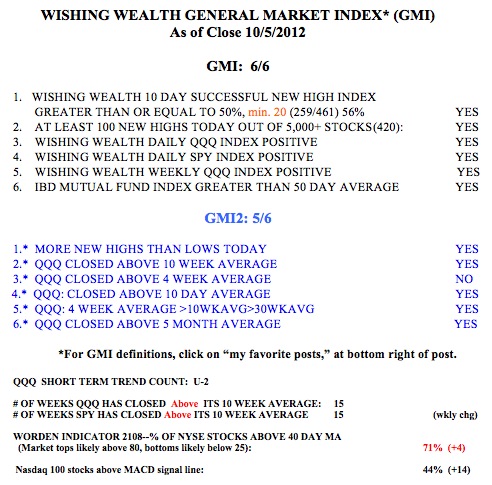
Meanwhile, the GMI remains strong, at 6 out of 6 and the T2108, at 71%, is in neutral territory.
3rd day of QQQ short term down-trend; Teach MarketWatch Contest Value of TA
Monday and Tuesday are critical days for the new QQQ short term down-trend. I have noted many times that I am more sure of a change of trend once it lasts for 5 days. I have a small position in QID and TECS, two leveraged ETF’s that rise as tech stocks decline. If the down-trend continues Monday I will start to add to these positions. I am still fully long in my university pension, given the strength in the longer term trends, as evidenced by the GMI still being in a buy range. The Worden T2108 Indicator, at 67%, is out of overbought territory. However, only 30% of the Nasdaq 100 stocks closed Friday with their MACD above its signal line, a sign of short term weakness in tech stocks.
As I posted last week, I entered the MarketWatch Investing Columnist competition. The rules invited people to submit charts, but they published my technical analysis (TA) piece without its chart, making it difficult to follow. They subsequently told me that their contest site could not accommodate charts. Help me to send a message about the importance of TA by voting (click like) for my submission at: http://blogs.marketwatch.com/great-columnist/2012/09/25/buy-high-rocket-higher/ or by clicking here. If each of you could ask two other persons to vote positive we could blow away their statistics and send a message about the value of TA……..
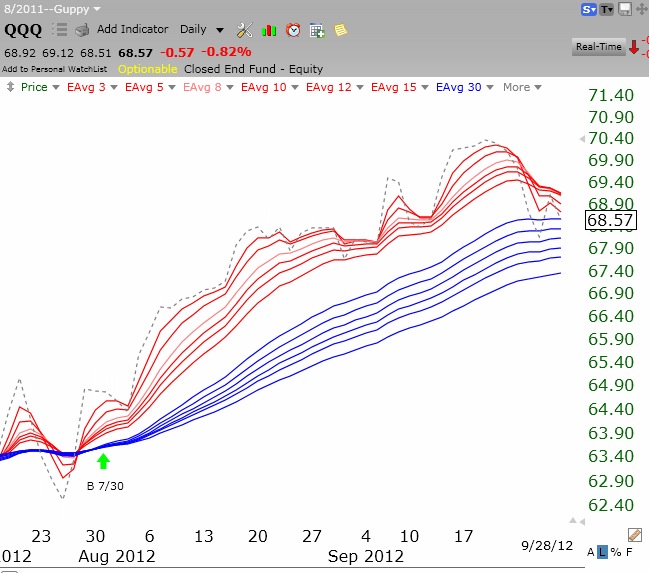
Speaking of TA, I want to share with you this daily RWB chart that I created for the QQQ (Nasdaq100 ETF). You will remember that a red/white and blue pattern reflects great strength in an advancing stock. It occurs when the short term exponential averages (red lines) are well above the rising longer term averages (blue lines) creating a white space in the middle. When the white space disappears the up-trend is weakening. If it ever turns into a daily BWR pattern, it signals a strong daily down-trend. The daily chart below shows that the RWB pattern that began near the time of the GMI “Buy” signal in late July is now ending. The light blue dotted line is the closing price of the ETF. In an up-trend, the dotted line leads the red averages higher, and in a decline the reverse is true. Click on chart to enlarge. The red lines are pointing down and heading towards the blue lines. The last time the red lines were below the blue was in late July just before the current up-trend began. (If you think TA like this is valuable, please vote for my submission to MarketWatch, as described above. )