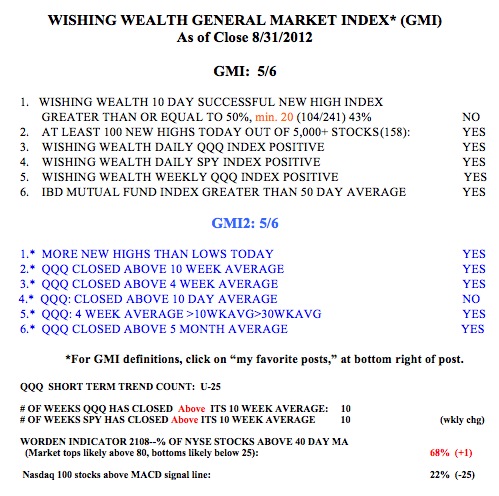
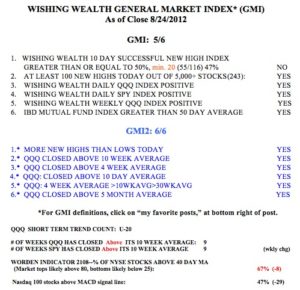
The GMI is at 5 (of 6) and the more sensitive GMI2 remains at 6 (of 6). I am riding this up-trend in QLD as well as some stocks. I find it most important to let the market dictate the trend and to ignore all news and media pundits’ advice. You can learn more about my GMI strategy and university class on technical analysis by ordering my Worden Work-Shop video from them here.
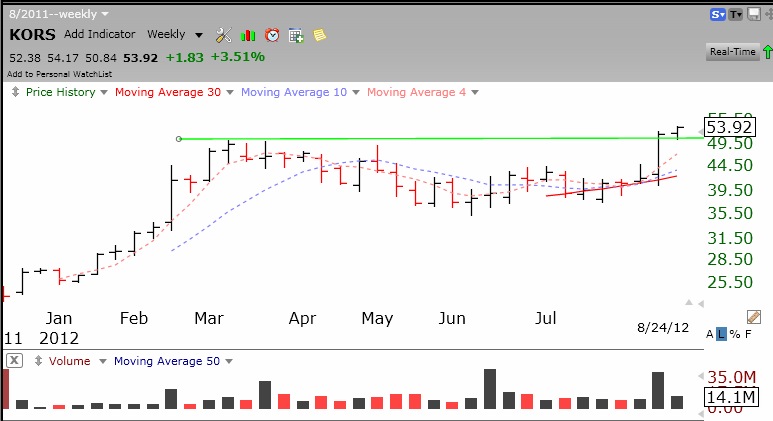
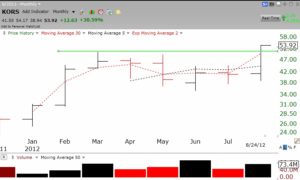
One of the best ways to buy an IPO is to wait for it to form its first base and to then buy it on the break-out to an all-time high. That is what I did with KORS last week. IBD picked up on KORS as it broke from its base. (When people ask me about buying FB, I always say I would become interested when/if it trades above $45.) Anyway, I had drawn a green line chart of KORS weeks ago and was ready to buy it if it broke to an all-time high. See the monthly green line chart below. The green line shows it all-time high. KORS came public and then doubled over the next 13 weeks. It then consolidated for about 6 months and broke out last week. The stock has the highest composite rating from IBD, 99th percentile, and is in my IBD 50 watch-list from August. Click on chart to enlarge.
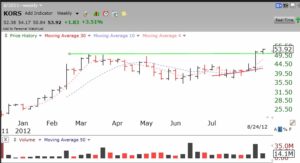
The weekly chart above shows several black volume spikes, the footprints of funds loading up on KORS. I am keeping an eye on this one.
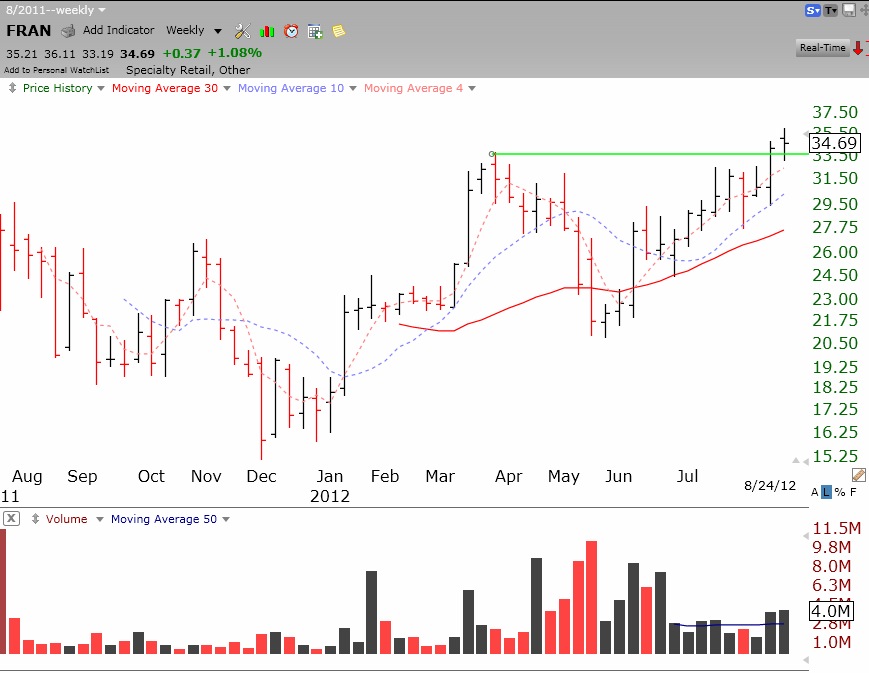
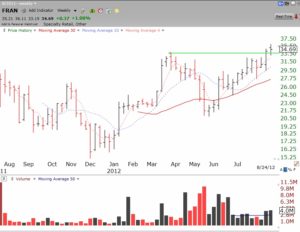
FRAN just came up on my Darvas Scan using TC2000. It recently broke out of a cup and handle base. It is also highly rated by IBD criteria. Note the weekly chart below. It is a recent IPO breaking to an all-time high, well worth researching.
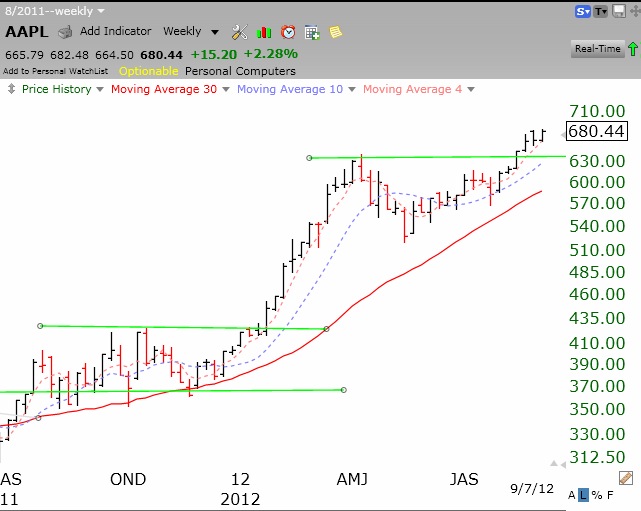
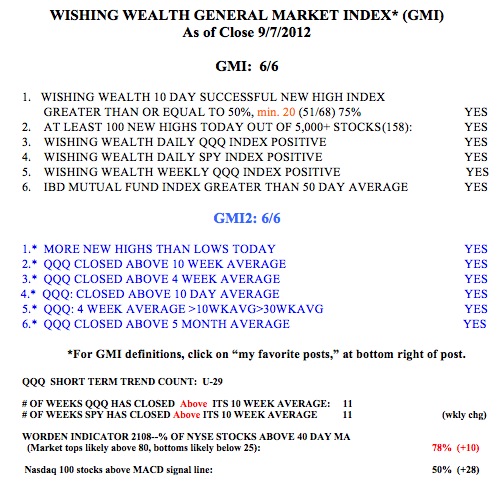 The GMI buy signal of July 30 remains in effect. 50% of the Nasdaq 100 stocks have now closed with their MACD above its signal line, a sign of short term strength. However, the Worden T2108 indicator is now at 78%, very close to extreme overbought territory. This week AAPL announces the new iphone 5. The reaction to the announcement will be very interesting to watch and may provide an indication of the health of the market, at least with regard to tech stocks. This weekly chart of AAPL shows how nicely AAPL has progressed since breaking a green line top to an all-time high a few weeks ago. Click on chart to enlarge.