Over 120 persons attended my AAII workshop presentation. It was great to meet some of my blog readers and to hear their personal stories regarding its value. I talked a lot about stage analysis and buying stocks at all-time highs. I thought I would comment on both today.
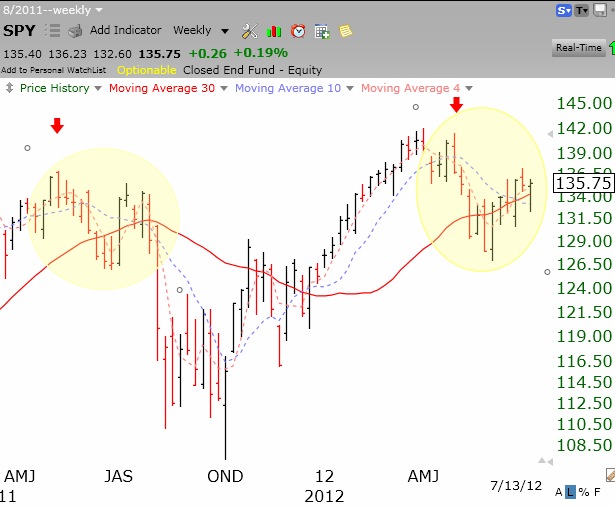
Stage analysis was introduced by Stan Weinstein in his book in the early 1980’s, listed to the bottom right of this blog. I told people that I only buy long when the market is in a Stage 2 up-trend and if the stock or ETF I am buying is also in a Stage 2 up-trend. The SPY is currently in a Stage 2 rise, as shown by this weekly chart of the SPY (S&P 500 ETF). Click on chart to enlarge.
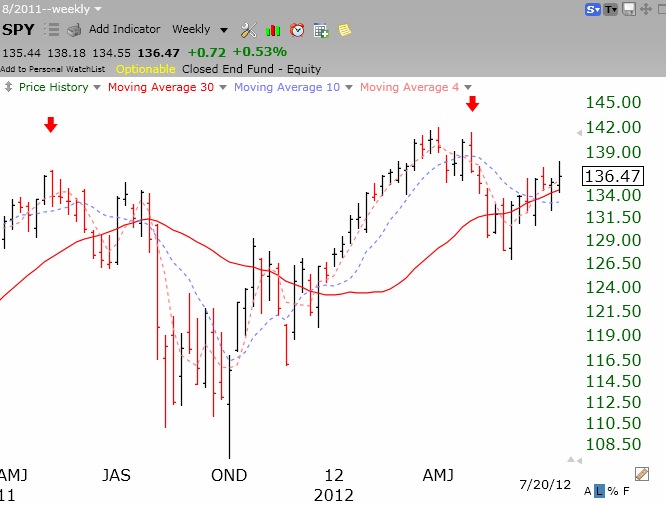 Note that the SPY is following along its 30 week average (red line). When the QQQ or SPY closes below this important average, I tend to get very defensive. I make no new buys and raise my stops. If this average eventually turns down, I typically get out of the market. One component of the GMI counts whether the QQQ has closed above its 30 week average…….
A second major point I made was that major market winners rise for a while and then rest in a base for several months and then break out of the top and repeat this cycle until the rise ends. I introduced to the attendees the “green line charts” of past winners. A horizontal green line is drawn on a monthly chart once a stock has risen to a new all-time high and then stays below the high for 3 or more months. By taking a look at past winners one can readily see the value of this approach. Take a look at this monthly chart of MSFT. Click on chart to enlarge.
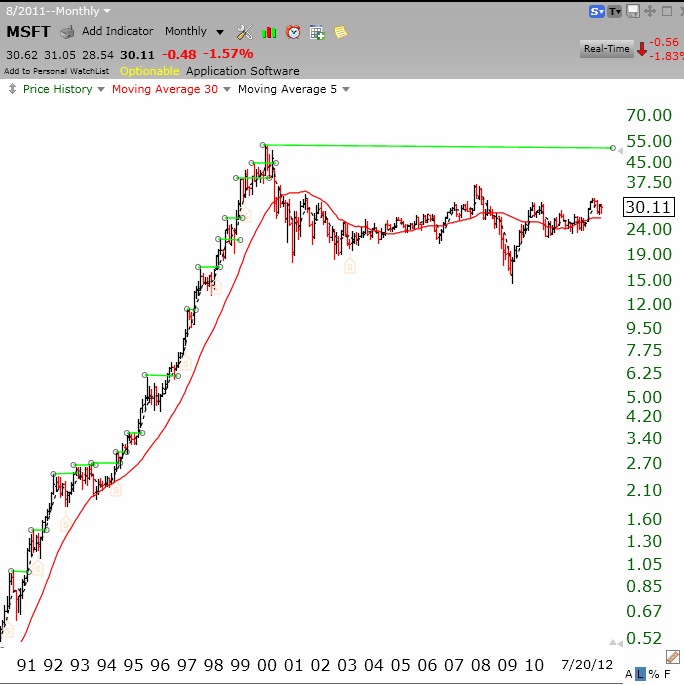
Note the many bases formed along its huge run from 1990 until 2000. This is what a rocket stock looks like. Anyone who was afraid to buy MSFT after the stock formed a multi-month base and broke to a new high lost out on a huge gain. After forming the top in 2000, MSFT has gone nowhere and is not worth buying or holding, according to my methods. When it closes above its 2000 high, I might become interested in buying MSFT, but don’t hold your breath! The moral of the story is to buy stocks that appear on the new high list after breaking recently through a green line base to an all-time high. Whenever I run a scan on stocks at a new high, I draw in the green line tops to get an idea of whether the stock is breaking out of its top base.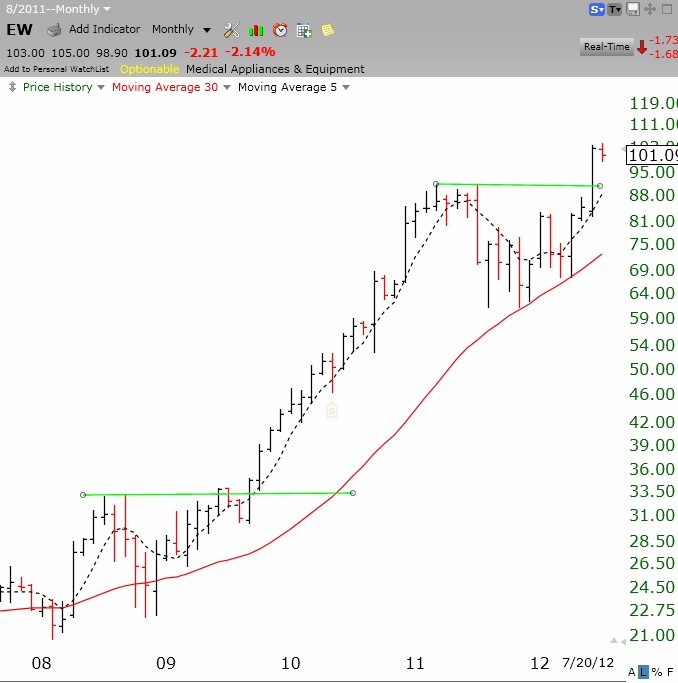 EW is a good example of such a stock. that may be worth researching……….
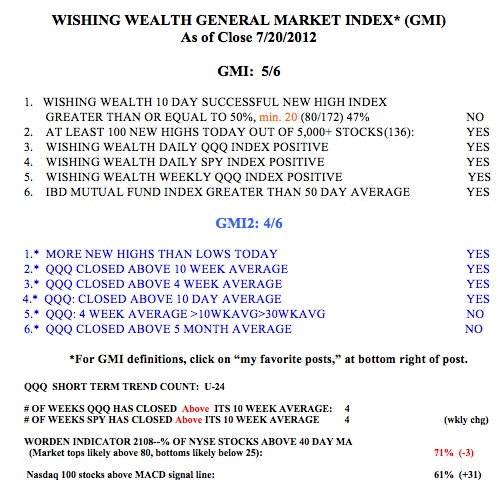
The GMI remains at 5 (out of 6) and the more sensitive GMI2 is at 4. The last GMI signal was a “Buy” on June 19. The QQQ also remains in a short term up-trend. For now, I am holding my long position and selling cash secured weekly puts on the SPY. Those of you who showed some interest in learning how to write covered calls, might look up Alan Ellman’s website or order his book listed to the lower right. The “Cashing In” book is a great primer on selling covered call options using technical analysis that is similar to mine.