With the GMI at 6, I am still willing to hold a small long position in QLD and several other stocks. Here comes second quarter earnings!

Stock Market Technical Indicators & Analysis
With the GMI at 6, I am still willing to hold a small long position in QLD and several other stocks. Here comes second quarter earnings!
Well, the expected window dressing came, but on the last day of the month! Now we get to see if the market can continue to climb or if it will go into a pre-earnings release lull. I suspect it will be the latter. There were 339 new highs on Friday in my list of 5,861 stocks. This was the highest number of new highs since March 26. The Worden T2108 is at 71%, still in neutral territory. I do not begin to worry about too much exuberance in the market until the T2108 reaches 80%. This market remains in a Weinstein Stage 2 up-trend. IBD now sees the market in a confirmed up-trend and the GMI Buy signal remains in effect. I will therefore gradually add to my long positions.
22 stocks showed up in my Darvas Scan. They are, in alphabetical order: ABAX,ABCO,ALXN,ASPS,CSTR,CYBX,DG,GEOI, IOC,ITIC,LL,QCOR,SHW,
SIX,SLXP,SUSS,SXCI,TCBI,TDG,ULTA,ULTI,ZUMZ.
14 of these 22 stocks are in my IBD50, CAN SLIM, or New America watchlists. All of these stocks passed my technical criteria and have good fundamentals. They are worth researching for possible buys………
This weekend the DC area was hit with a sudden fierce storm that brought down electrical power for over 500,000 people. The storm slowed everything down with many traffic lights not working. I was unable to spend as much time as usual on this blog. However, with a shortened holiday week upon us I hope to write more later this week.

In spite of the market turbulence last week, the new QQQ short term up-trend held, and reached its critical 5th day on Friday. I have found that once a new QQQ trend lasts for 5 days, it is likely to continue for a while. Given that this week is the end of the second quarter and may result in mutual fund window dressing, this new up-trend may gain strength. I own some QLD and have sold cash-secured puts on SPY. Writing cash-secured puts is similar in risk to buying the stock and writing a covered call on it. If you want to learn how to write covered calls, I highly recommend the easy to understand approach of Dr. Alan Ellman. His introductory book on the subject, “Cashing in on Covered Calls” is listed to the right of this post. More advanced readers may want to see his more comprehensive and recent Encyclopedia book, also listed here. (If you order from my site I make a small fee from Amazon that I can use to compensate my son for maintaining this site. Thank you in advance.)
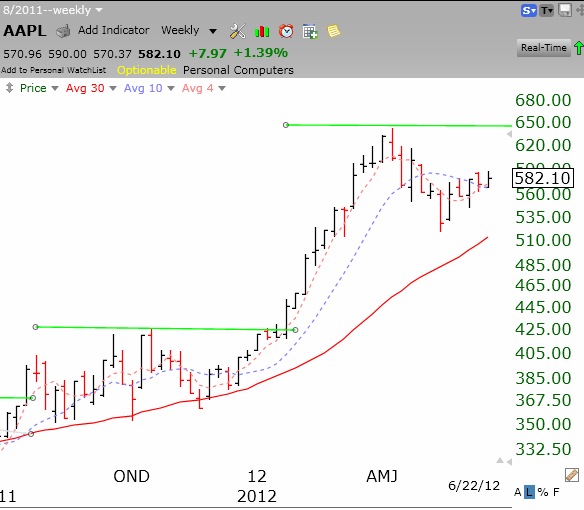
While the GMI is 5, the more sensitive GMI2 is only 3, and the QQQ and SPY remain below their 10 week averages.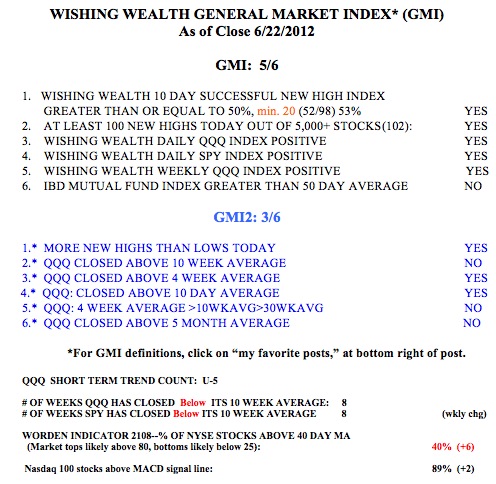 So I remain cautiously long in my trading accounts. I am ready to get out quickly if the market turns down. 89% of the Nasdaq 100 stocks closed with their MACD above its signal line, a sign of short term strength. And the T2108 is in neutral territory, at 40%. AAPL held up last week and firmed on Friday. (See weekly chart below.) This is another promising sign for the tech stocks. AAPL is one of those strong stocks that mutual funds buy up at the end of the quarter. Then we can watch AAPL as it approaches its second quarter earnings release. Stocks often rise in anticipation of good earnings.
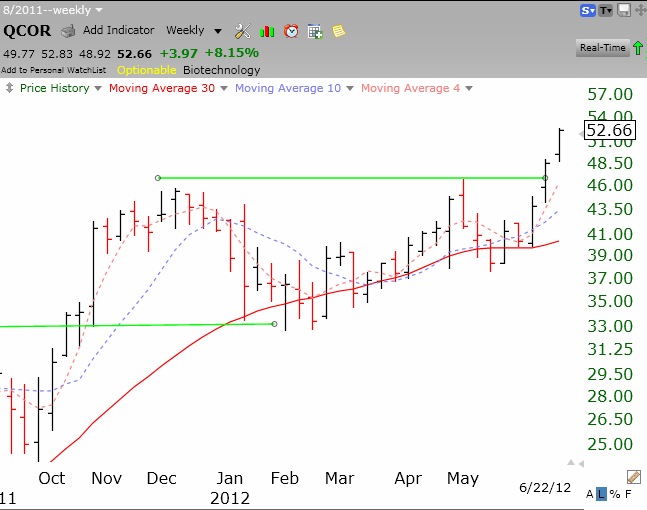
On June 18 I wrote that QCOR was breaking from a base and I presented its monthly chart showing the tops of prior bases. This weekly chart shows that QCOR has broken from a cup-with-handle base. It has held up beautifully during the recent week’s volatility, hitting a new all-time high on every day last week but Thursday. But it is the number 1 stock in this week’s IBD 50. Some people think the number 1 stock in the IBD 50 is at a peak. ASPS, the other stock I wrote about last Monday also held up well last week. The daily new high list is definitely where to spot likely winners!
Six stocks came up on my TC2000 new high with good fundamentals scan as of Friday’s close: NATH,SUSS,JACK,ALGT,DVA,QCOR.
AAPL rose $7.97 last week. Will sufficient buying pressure emerge to enable it to surpass its recent peak (top green line)?