KORS looking very strong, has green line break-out

GMI6/6
GMI-26/9
T210878%

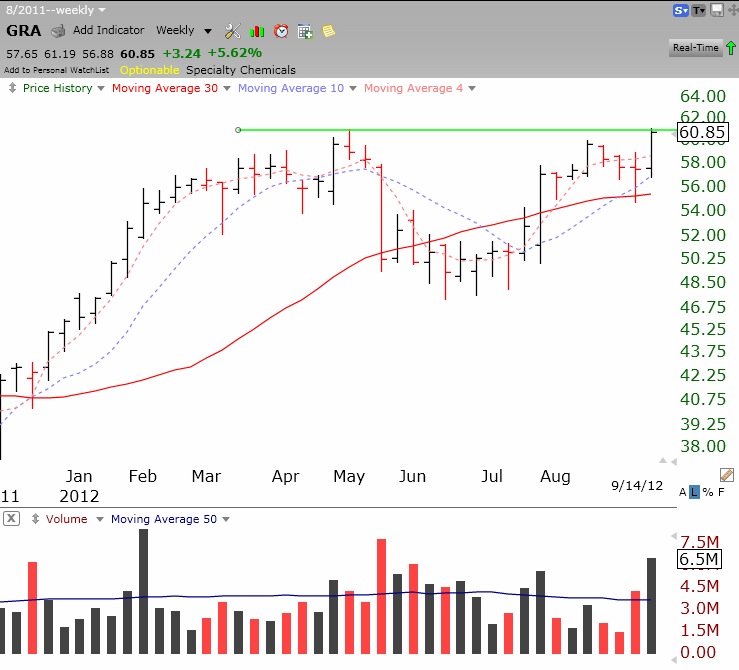
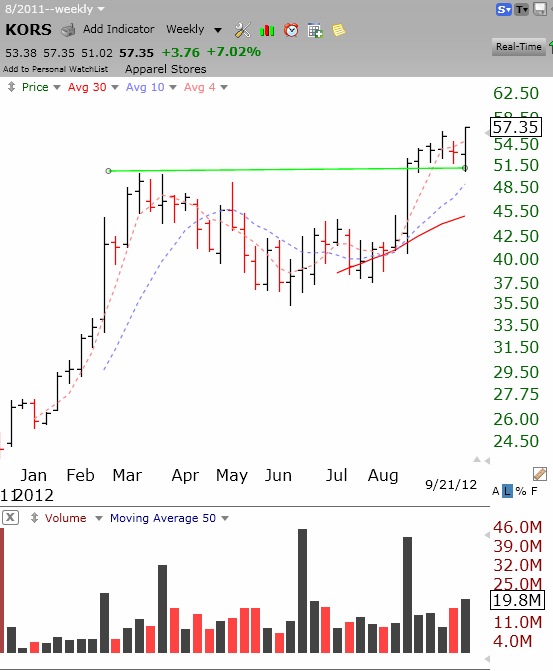
With the GMI and GMI2 at maximum readings I am still looking for promising stocks.   I wrote last week about LNKD and today I am highlighting KORS, which I own.   KORS came public in December, 2011, doubled, and then consolidated for about six months. I drew in a green line top on its monthly chart, indicating that the stock formed a top at an all-time high.   KORS broke above the green line in August and has spent five weeks trading back and forth just above the green line, which now serves as support.   Last Friday, however, KORS   surged to a new high on the highest   volume since August 14.   KORS has an IBD Composite rating of 99, the highest possible rating. Check out this weekly chart of KORS. Note the black spikes indicating a lot of trading volume during up weeks. KORS reports earnings on October 28.

Stocks that have come public in the recent past and that show movement to new highs often can have terrific runs when they prove themselves, as more mutual funds begin to notice and   accumulate the new stock. When I buy a stock that has a green line break-out I set my stop loss below the green line. If my analysis is correct, the stock should not close below the green line.

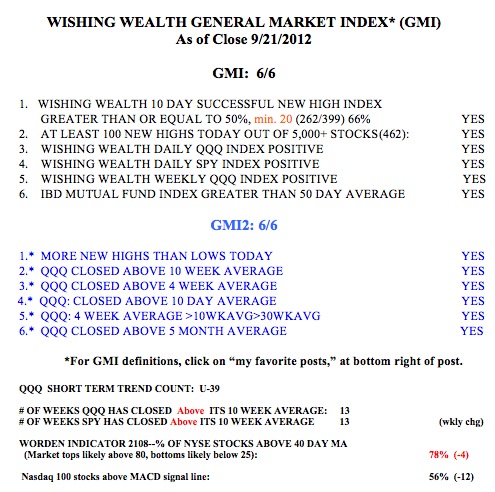
The GMI has been flashing a buy signal since July 30.   The only warning sign I see in the table below is the high T2108 reading (78%).   Readings above 80% can often persist for several months as a temporary top forms.

Market roars on with the GMI-informed QLD strategy beating most stocks; GRA break-out

GMI6/6
GMI-26/9
T210882%

On Friday there were   680 new 52 week highs in my universe of stocks, the most since December, 2010! If I had invested in the QQQ ETF since the GMI flashed a buy signal on July 30, 2012 my account would be up +8.3%,   if in DIA +4.2%, SPY +6.2%,     AAPL +16.2% and in QLD + 16.9%, .   Investing in the leveraged QQQ 2X long ETF, QLD,   again beats investing in these other things.   How many times have I learned this lesson, to just invest in QLD when the GMI issues a buy signal (and QID when it issues a sell signal). It sure beats looking for the “needle in the haystack” that will outperform QLD. In fact, only 11 of the Nasdaq 100 stocks advanced more than QLD in this period.   Furthermore,     QLD during this period beat 89% of the Nasdaq 100 stocks and 86% of the S&P 500 stocks. And   QLD is dependent on the Nasdaq100 stocks, not just one stock. Sometimes I think I should replace myself with a computer that will simply trade QLD or QID in accordance with the GMI signals. (I know the 3x technology bull ETF,   TECL,   did even better, + 25.9%.)

By the way, GRA had a cup and handle green line break-out last week.   I had set a TC2000 alert weeks ago and when it triggered last week I bought some GRA. Check out this weekly chart and note the high trading volume last week. Click on chart to enlarge.


29th day of QQQ short term up-trend; AAPL’s week

GMI6/6
GMI-26/9
T210878%

Both the GMI and GMI2 are at their maximum readings.     The GMI buy signal of July 30 remains in effect. 50% of the Nasdaq 100 stocks have now closed with their MACD above its signal line, a sign of short term strength. However, the Worden T2108 indicator is now at 78%, very close to extreme overbought territory. This week AAPL announces the new iphone 5.   The reaction to the announcement will be very interesting to watch and may provide an indication of the health of the market, at least with regard to tech stocks. This weekly chart of AAPL shows how nicely AAPL has progressed since breaking a green line top to an all-time high a few weeks ago. Click on chart to enlarge.