ONVO, a highly speculative one of “Judy’s Picks, ” has been on a roller coaster the past two weeks. This article provides more information about why this company is so interesting. I am holding some ONVO long term just in case the firm’s bio-printing business becomes profitable. The two other major 3D printing companies, DDD and SSYS, have been or quite a run….
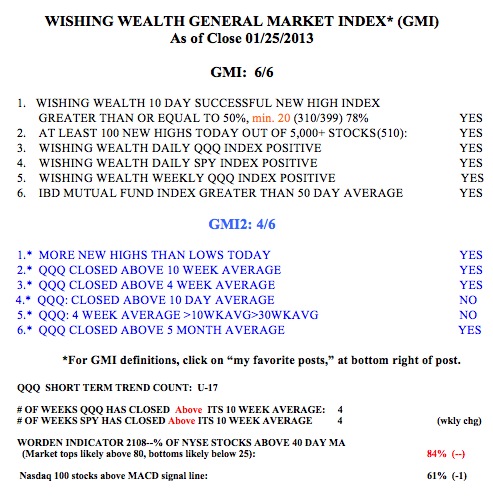
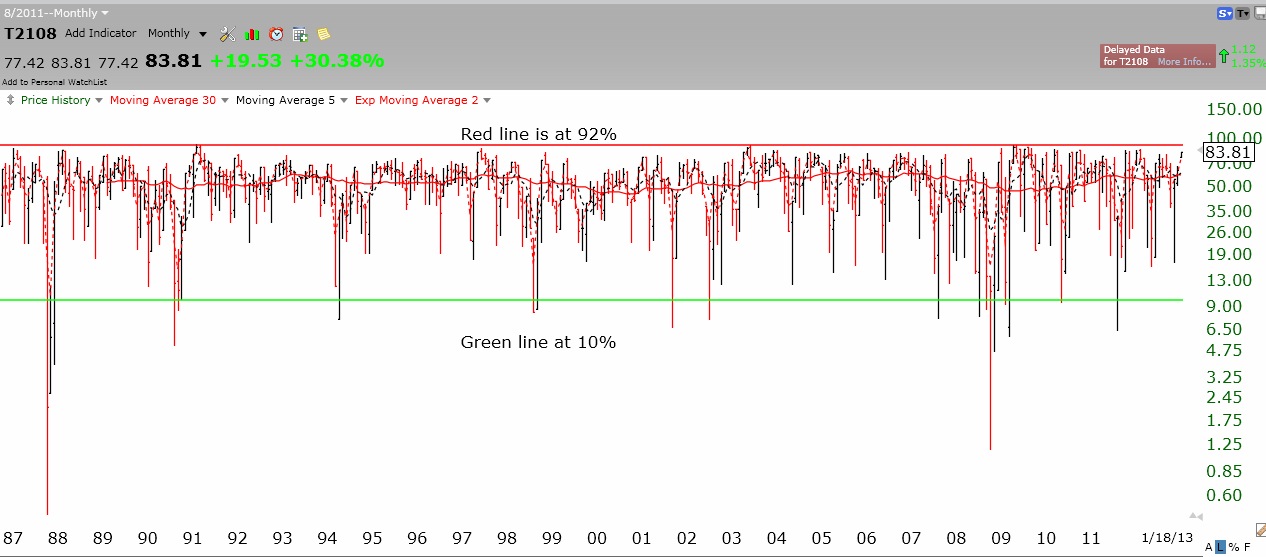
The GMI has been at 6 (of 6) for 17 straight days. During this time the SPY has advanced +2.87%, the DIA +3.73% and the QQQ +0.22%. Clearly, tech stocks as measured by the Nasdaq 100 index, have underperformed during this rally. This is largely caused by the overweighting of AAPL in this index. AAPL has declined -17.3% during this same time period. I am a little cautious with the T2108 at 84%. While T2108 does not stay so high for a long time, the market can continue to climb for some time after the T2108 peaks. So I am not too concerned yet. However, after earnings come out there will likely be some retracement. The fact that over 53% of investment advisers are bullish and only 22% are bearish is another concern that this rally may be getting old. The Investors Intelligence poll is a trusted contrary indicator. When most advisors turn bullish it is nearer to the end of a rise.