Many of you have requested that I post a chart showing the recent performance of the GMI over the past year. The GMI, though not perfect, has successfully kept me on the right side of the market through the 2000-2002 and 2008 bear market declines. I simply go to cash in my university pension and trade the short side in my IRA once the GMI starts to remain consistently below 3. In order to show the GMI over time, I have plotted a weekly chart with the GMI changes for the last day of each week.
General Market Index (GMI) table
Why search for individual stocks when we can ride the ultra ETF’s?
It is rare that I complete an analysis whose findings totally surprise me, but take a look at this one. A lot of the pundits claim that the ultra ETF’s, leveraged baskets of stocks that try to double or triple the performance of their underlying indexes or sectors, fail to achieve their goals. So, just to satisfy my curiosity, I compared the performance of the primary index ETF’s, SPY (S&P500) , DIA (Dow 30) and QQQQ (Nasdaq 100) with those of the leveraged ETF’s. There were exact comparisons for these indexes for the 2X ETF’s, but I had to choose other, more general indexes for the 3X ETF’s. The results blew me away…
The 2X and 3X Ultra ETF’s absolutely outperformed the standard index ETF’s in the period since the March bottom. For example, while the QQQQ (Nasdax 100) index ETF rose 42.9% in this period, the QLD (2x QQQQ ETF) rose 99.2% and the TYH (technology bull 3X ETF) rose 179.4%. In comparison, the top five individual stock performers in the Nasdaq 100 stocks rose from 138.8% (JAVA) to 180.57% ( STX). In fact, only 16 stocks (16%) in the Nasdaq100 (and 23% in the S&P500) rose 80% or more. So, the choice before us is to search for the needle in the 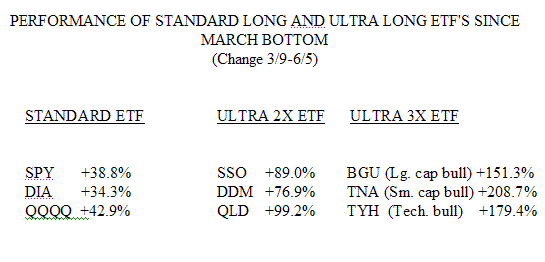 haystack individual stock that might do really well in a bull rise, or to buy one of these 2X or 3X ultra long ETF’s and ride a basket of stocks with a lot more diversification and probably less risk than owning individual stocks. The key is to discern the trend accurately and to then ride the ultra ETF with the most potential for following that trend. Some ultra ETF’s also trade options…..
Rally gaining strength; Guppy chart reveals major turn
If calling the short term trend of the market were easy, we would all be rich and retired. Last week, my short term QQQQ indicator gave me a head fake and turned my daily trend count down. That new downtrend lasted for two days and then the up-trend resumed. However, I had indicated at the time that my short and long term QQQQ indicators were giving inconsistent readings, with the long term indicator remaining in an up-trend. The new short term up-trend just completed its 3rd day.
The more that I analyze the market, the more I become convinced that I should rely on the longer term weekly trends to determine the market trend (see discussion of the Guppy chart below). The QQQQ has been above its critical 10 week average for 11 weeks and the SPY for 10 weeks. But I have told you that I am a chicken, and would rather go to cash at the first sign of weakness and re-enter the market later, after the dust has cleared. I actually have other, personal reasons, for why I am unwilling to enter the market right now. I cannot trade successfully when I am stressed by other concerns. The only stock I own is ASIA, with a close stop loss.