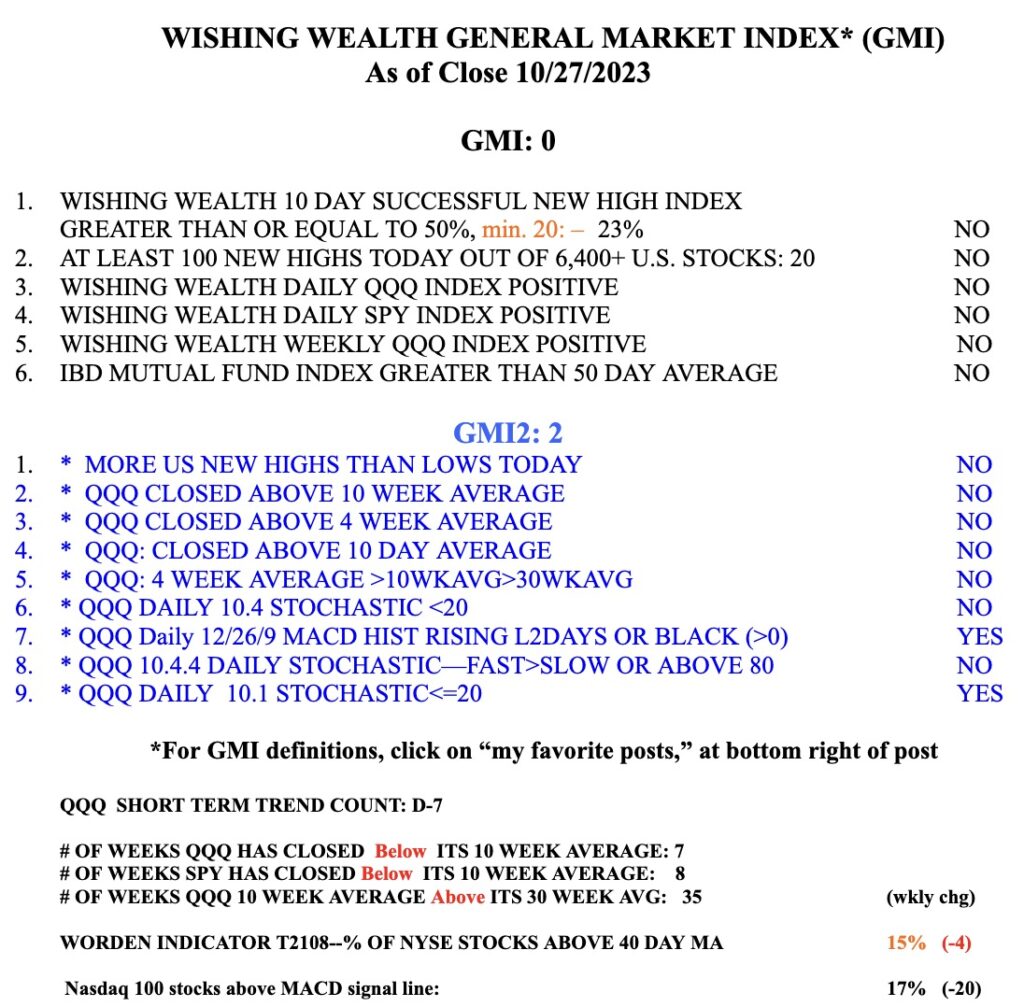
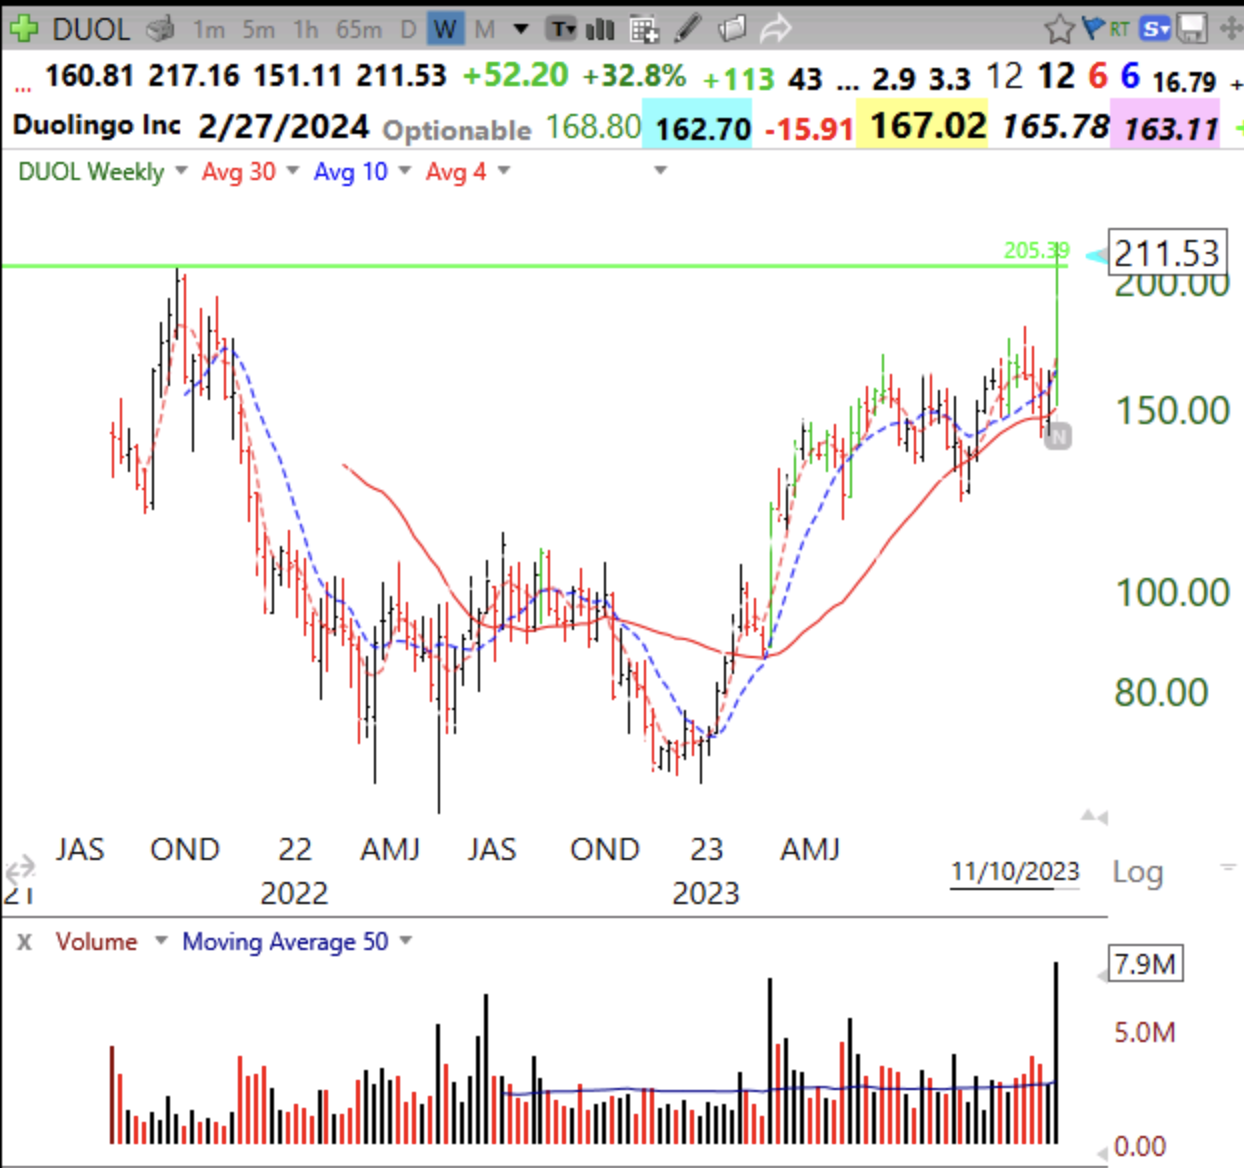
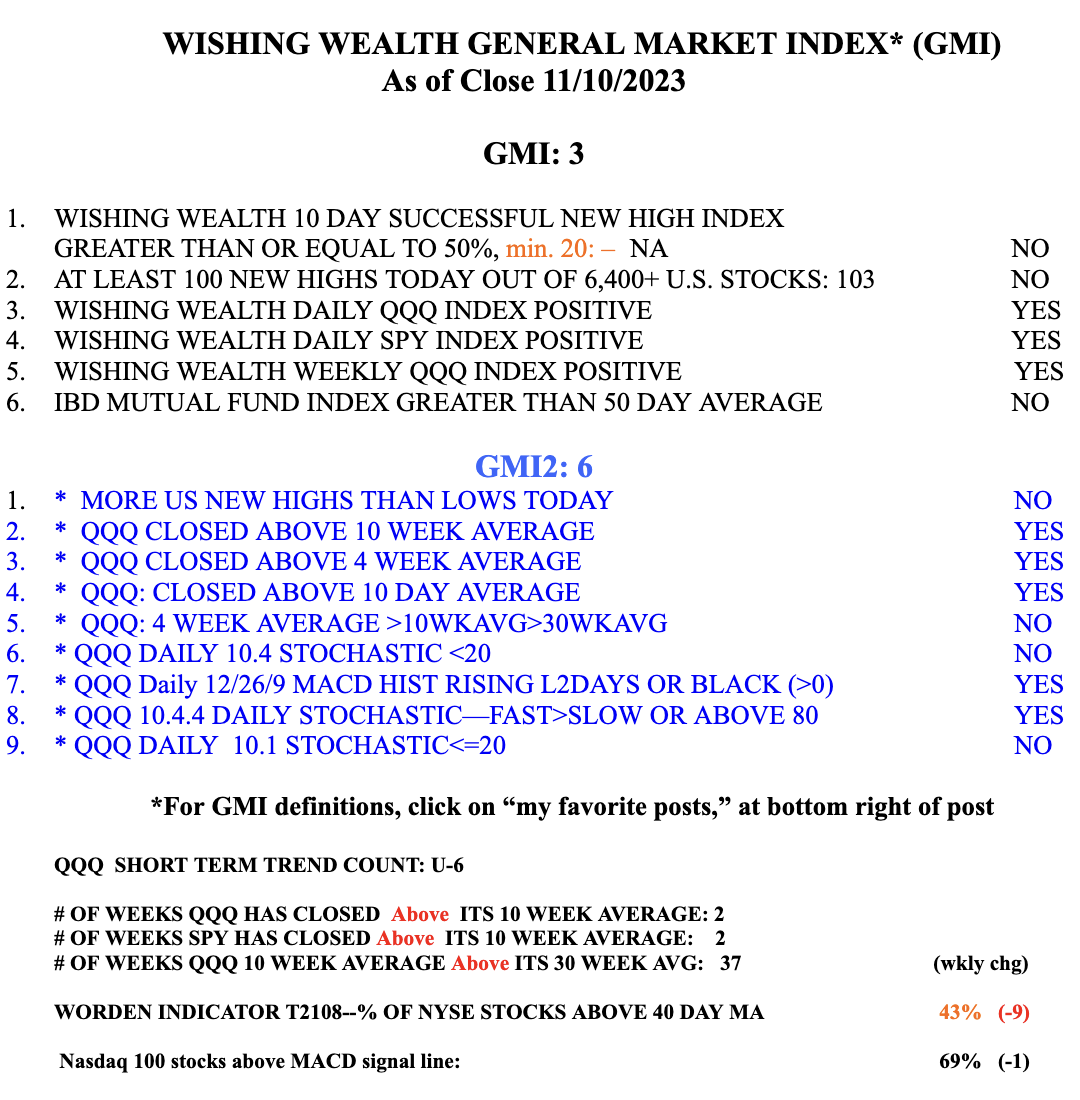
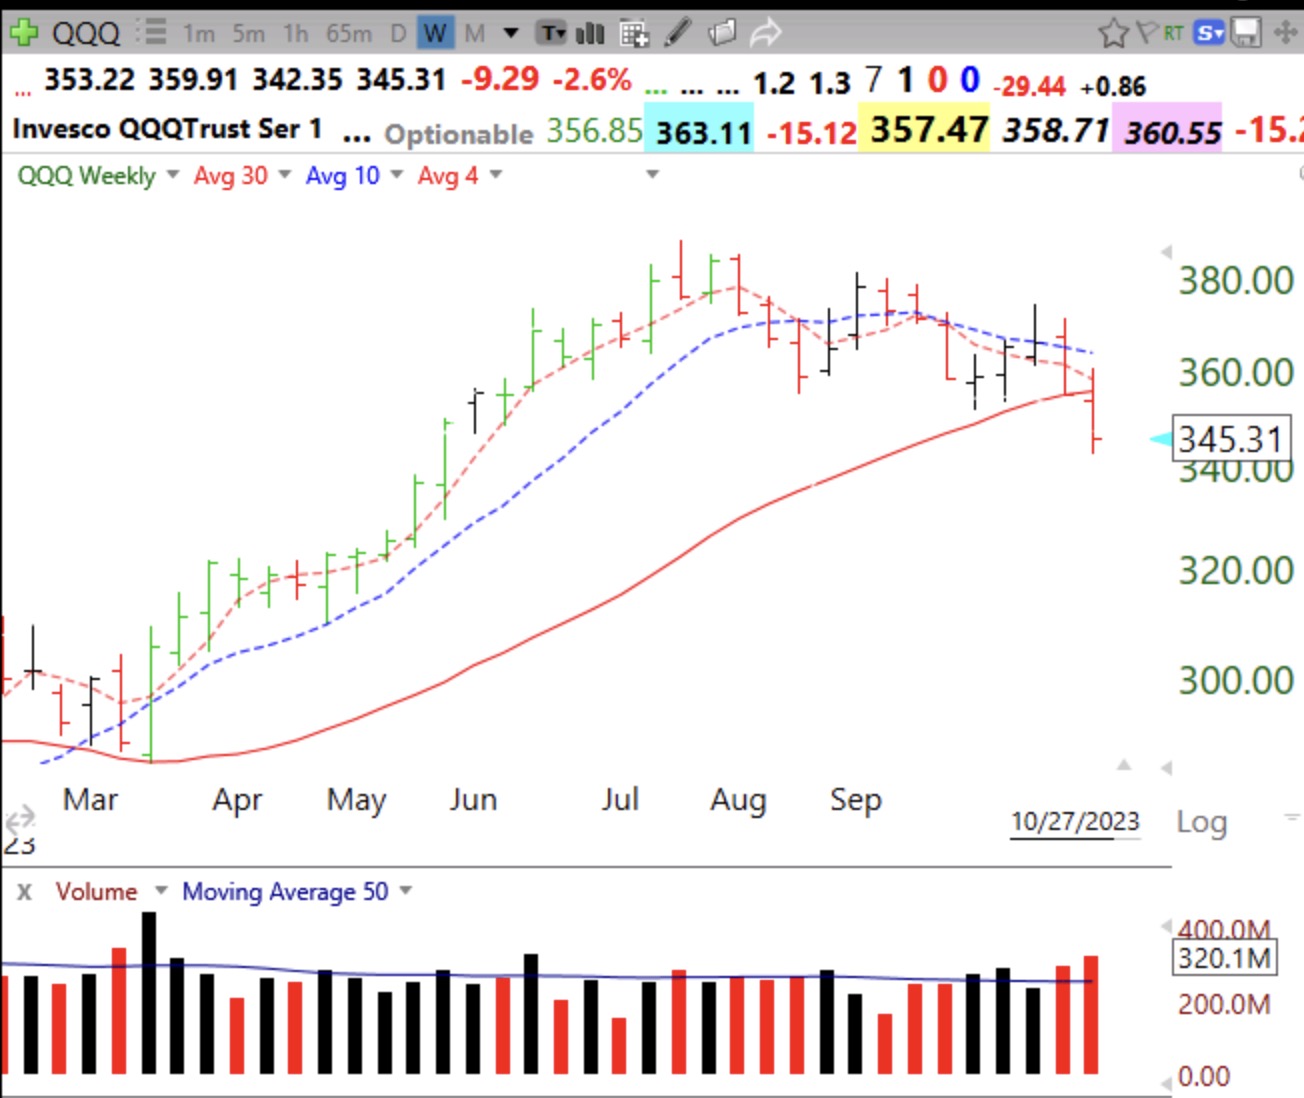
I am VERY concerned about what my indicators are telling me. The GMI=0 now that QQQ has closed below its 30 week average (see chart below), as have 3 of the “Magnificent 7” that have held the indexes up this year: AAPL, GOOGL and TSLA have faltered. I remember the nifty 50 large cap stocks in the the 70s that the market pundits asserted you could buy and hold forever. They crashed beginning with the bear market in 1974. Anyone hear about Polaroid or Eastman Kodak anymore? Now we have the Mag 7, which because of their huge market caps, drove the cap weighted indexes, SPY and QQQ, higher while obscuring the fact that many of their component stocks languished. Look at the Dow, down for the year, in comparison. Now the Mag 7 are weakening and so will the market indexes. Over my investing life, since the 1960s, it was my generation of Boomers that drove the economy and the market. Now with many of us nearing retirement and dreading relying on selling our investments to live on (remember RMDs) we will abandon stocks and mutual funds to hold safer investments like short term treasuries, CDs and high yield savings accounts. If that is the case, we might be on the verge of a decade long stall in stocks. Think about it.
My indicators look the way they do before the major decline gets going. So, I am out of almost all equities in my savings and retirement accounts. I typically retreat early. How many Boomers are going to join me over the next decade? It will likely take very low interest rates to entice Boomers to assume market risk again.

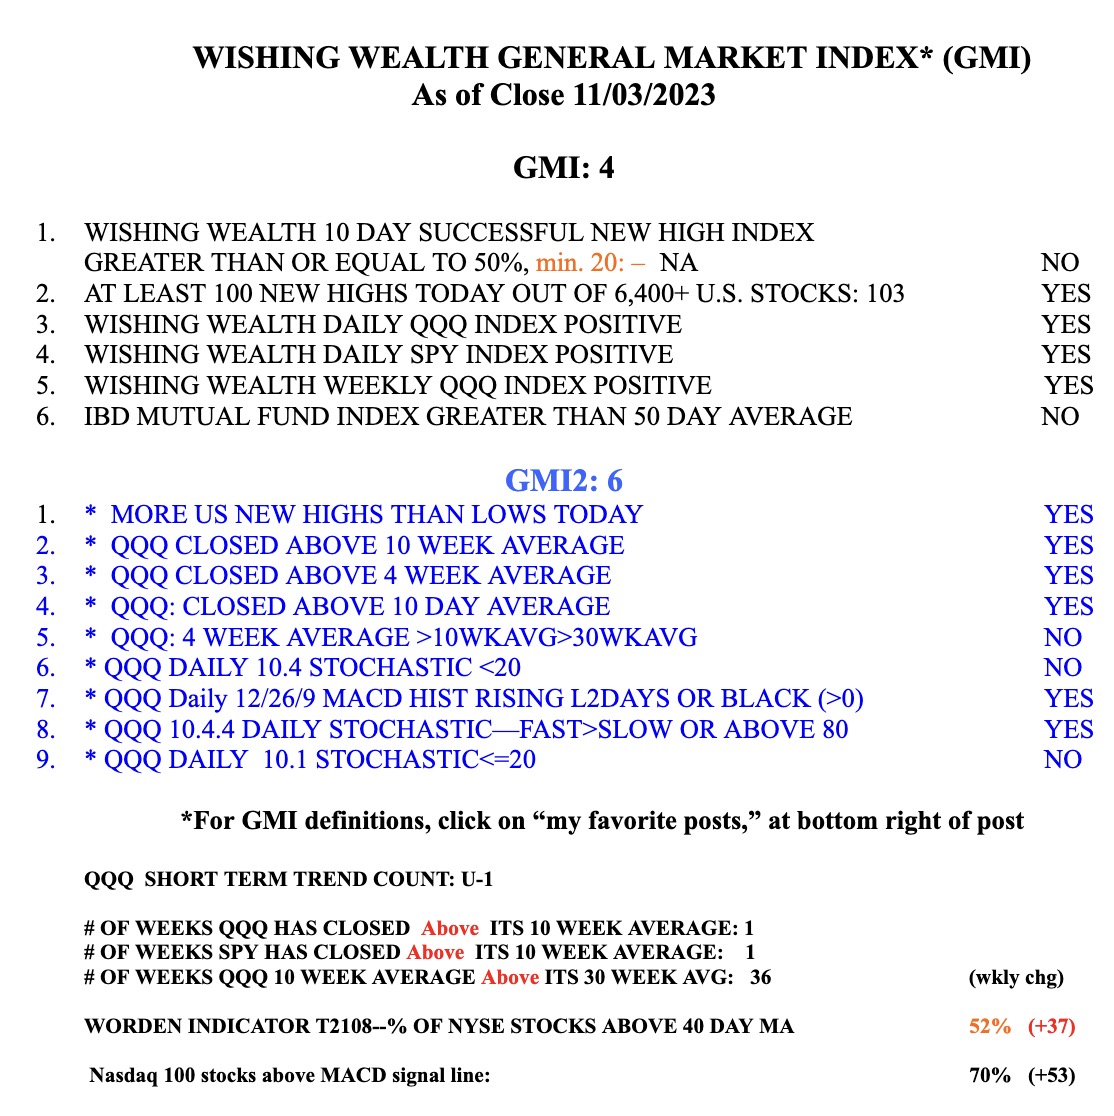
The GMI=0, no time for stocks.